Suriname population
579,664
Births this year: 0
Births today 0
Deaths this year 6,160
Deaths today 1
579,664
| Region Name | Percents | Number |
|---|---|---|
| Hindu | 27.4% | 160,516 people |
| Protestant (predominantly Moravian) | 25.2% | 147,628 people |
| Roman Catholic | 22.8% | 133,568 people |
| Muslim | 19.6% | 114,822 people |
| indigenous beliefs | 5% | 29,291 people |
| Ethnic groups Name | Percents | Number |
|---|---|---|
| Hindustani | 100% | 585,824 people |
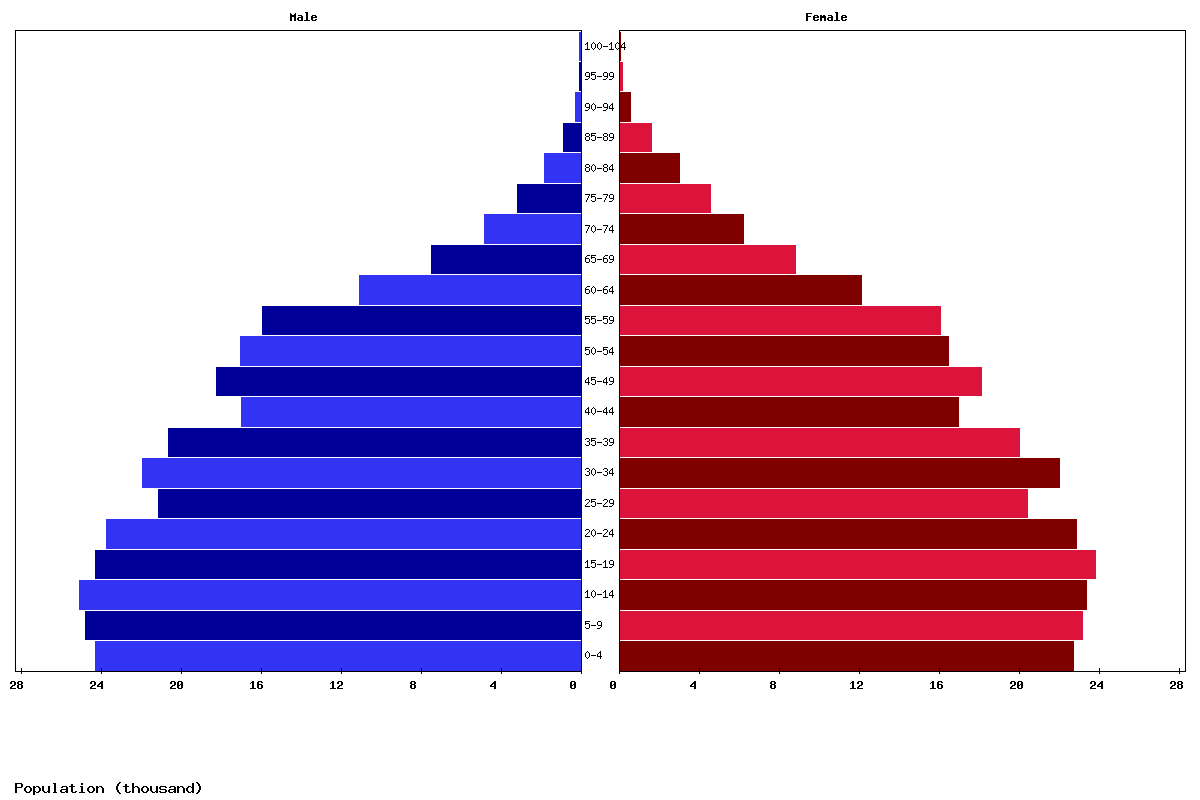
| Age | Both Sexes Population | Male Population | Female Population | Both Sexes (%) | Male (%) | Female (%) | Sex ratio (female/male) |
|---|---|---|---|---|---|---|---|
| Total | 583,819 | 291,409 | 292,410 | 100 | 100 | 100 | 99.7 |
| 00-04 | 45,784 | 23,535 | 22,249 | 7.8 | 8.1 | 7.6 | 105.8 |
| 05-09 | 46,586 | 24,045 | 22,541 | 8 | 8.3 | 7.7 | 106.7 |
| 10-14 | 47,637 | 24,631 | 23,006 | 8.2 | 8.5 | 7.9 | 107.1 |
| 15-19 | 47,722 | 24,706 | 23,016 | 8.2 | 8.5 | 7.9 | 107.3 |
| 20-24 | 46,853 | 23,643 | 23,210 | 8 | 8.1 | 7.9 | 101.9 |
| 25-29 | 45,265 | 22,988 | 22,277 | 7.8 | 7.9 | 7.6 | 103.2 |
| 30-34 | 40,407 | 20,481 | 19,926 | 6.9 | 7 | 6.8 | 102.8 |
| 35-39 | 42,797 | 21,235 | 21,562 | 7.3 | 7.3 | 7.4 | 98.5 |
| 40-44 | 39,612 | 19,968 | 19,644 | 6.8 | 6.9 | 6.7 | 101.6 |
| 45-49 | 32,938 | 16,348 | 16,590 | 5.6 | 5.6 | 5.7 | 98.5 |
| 50-54 | 35,075 | 17,407 | 17,668 | 6 | 6 | 6 | 98.5 |
| 55-59 | 31,853 | 15,975 | 15,878 | 5.5 | 5.5 | 5.4 | 100.6 |
| 60-64 | 29,634 | 14,416 | 15,218 | 5.1 | 4.9 | 5.2 | 94.7 |
| 65-69 | 20,624 | 9,525 | 11,099 | 3.5 | 3.3 | 3.8 | 85.8 |
| 70-74 | 13,629 | 5,952 | 7,677 | 2.3 | 2 | 2.6 | 77.5 |
| 75-79 | 8,423 | 3,434 | 4,989 | 1.4 | 1.2 | 1.7 | 68.8 |
| 80-84 | 5,109 | 1,893 | 3,216 | 0.9 | 0.6 | 1.1 | 58.9 |
| 85-89 | 2,626 | 873 | 1,753 | 0.4 | 0.3 | 0.6 | 49.8 |
| 90-94 | 986 | 288 | 698 | 0.2 | 0.1 | 0.2 | 41.3 |
| 95-99 | 224 | 58 | 166 | 0 | 0 | 0.1 | 34.9 |
| 100+ | 35 | 8 | 27 | 0 | 0 | 0 | 29.6 |
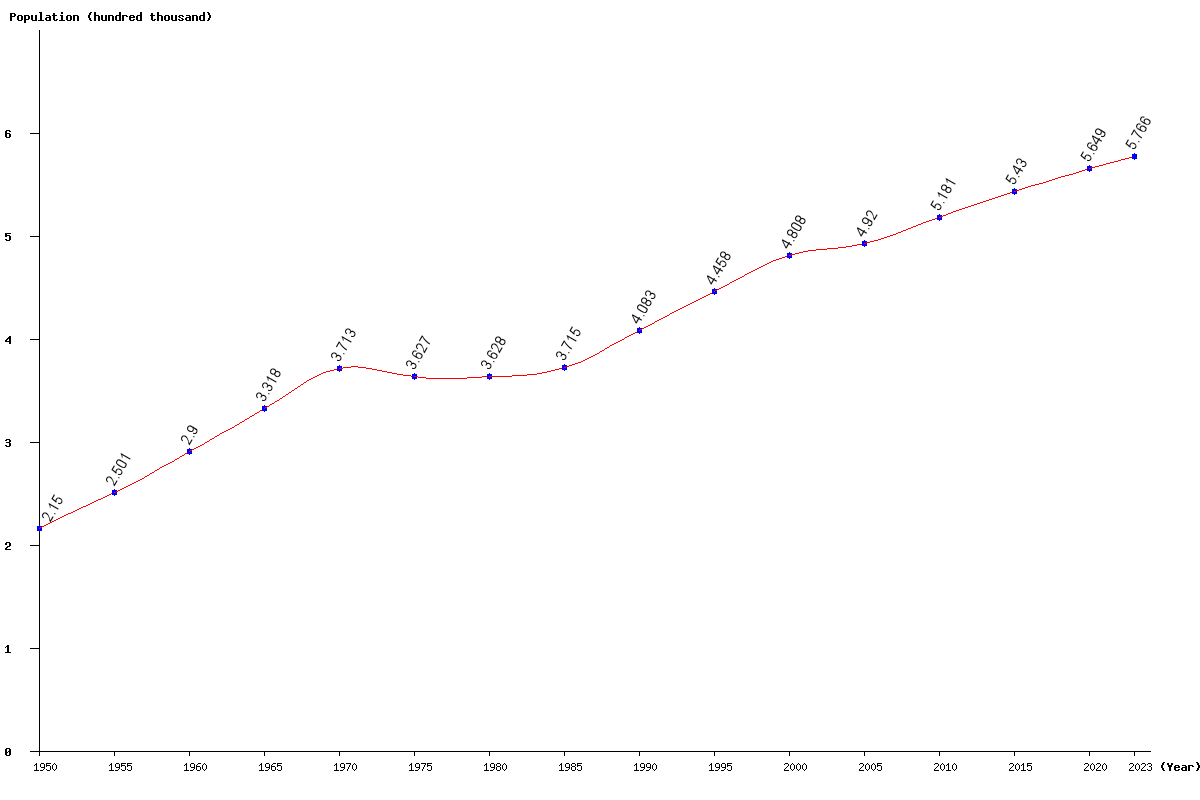
| Year | Population | Yearly % Change |
Yearly Change |
Sex ratio | Density (P/Km²) |
|---|---|---|---|---|---|
| 2025 | 583,819 | 0.61 | 3,524 | 99.66 | 3.74 |
| 2024 | 580,295 | 0.63 | 3,661 | 99.76 | 3.72 |
| 2023 | 576,634 | 0.66 | 3,794 | 99.86 | 3.70 |
| 2022 | 572,840 | 0.69 | 3,916 | 99.94 | 3.67 |
| 2021 | 568,924 | 0.71 | 4,036 | 100.03 | 3.65 |
| 2020 | 564,888 | 0.74 | 4,147 | 100.10 | 3.62 |
| 2019 | 560,741 | 0.76 | 4,256 | 100.18 | 3.59 |
| 2018 | 556,485 | 0.79 | 4,373 | 100.24 | 3.57 |
| 2017 | 552,112 | 0.82 | 4,502 | 100.30 | 3.54 |
| 2016 | 547,610 | 0.85 | 4,635 | 100.36 | 3.51 |
| 2015 | 542,975 | 0.88 | 4,727 | 100.41 | 3.48 |
| 2014 | 538,248 | 0.90 | 4,798 | 100.46 | 3.45 |
| 2013 | 533,450 | 0.93 | 4,915 | 100.51 | 3.42 |
| 2012 | 528,535 | 0.97 | 5,096 | 100.55 | 3.39 |
| 2011 | 523,439 | 1.02 | 5,298 | 100.59 | 3.36 |
| 2010 | 518,141 | 1.10 | 5,619 | 100.61 | 3.32 |
| 2005 | 491,999 | 2.34 | 11,248 | 100.78 | 3.15 |
| 2000 | 480,751 | 7.83 | 34,921 | 102.37 | 3.08 |
| 1995 | 445,830 | 9.20 | 37,554 | 102.74 | 2.86 |
| 1990 | 408,276 | 9.91 | 36,807 | 103.21 | 2.62 |
| 1985 | 371,469 | 2.40 | 8,692 | 103.47 | 2.38 |
| 1980 | 362,777 | 0.03 | 126 | 102.04 | 2.33 |
| 1975 | 362,651 | -2.32 | -8,617 | 100.55 | 2.32 |
| 1970 | 371,268 | 11.90 | 39,469 | 99.62 | 2.38 |
| 1965 | 331,799 | 14.42 | 41,827 | 99.29 | 2.13 |
| 1960 | 289,972 | 15.95 | 39,878 | 100.01 | 1.86 |
| 1955 | 250,094 | 16.32 | 35,095 | 101.62 | 1.60 |
| 1950 | 214,999 | 99.07 | 1.38 |