South Africa population
5,430,070
Births this year: 0
Births today 0
Deaths this year 0
Deaths today 0
5,430,070
| Region Name | Percents | Number |
|---|---|---|
| Protestant (Zionist Christian, Pentecostal/Charismatic, Methodist, Dutch Reformed, Anglican) | 36.6% | 1,987,406 people |
| Catholic | 7.1% | 385,535 people |
| Muslim | 1.5% | 81,451 people |
| other Christian | 36% | 1,954,825 people |
| other | 2.3% | 124,892 people |
| unspecified | 1.4% | 76,021 people |
| none | 15.1% | 819,941 people |
| Ethnic groups Name | Percents | Number |
|---|---|---|
| black African | 79.2% | 4,300,615 people |
| white | 8.9% | 483,276 people |
| colored | 8.9% | 483,276 people |
| Indian/Asian | 2.5% | 135,752 people |
| other | 0.5% | 27,150 people |
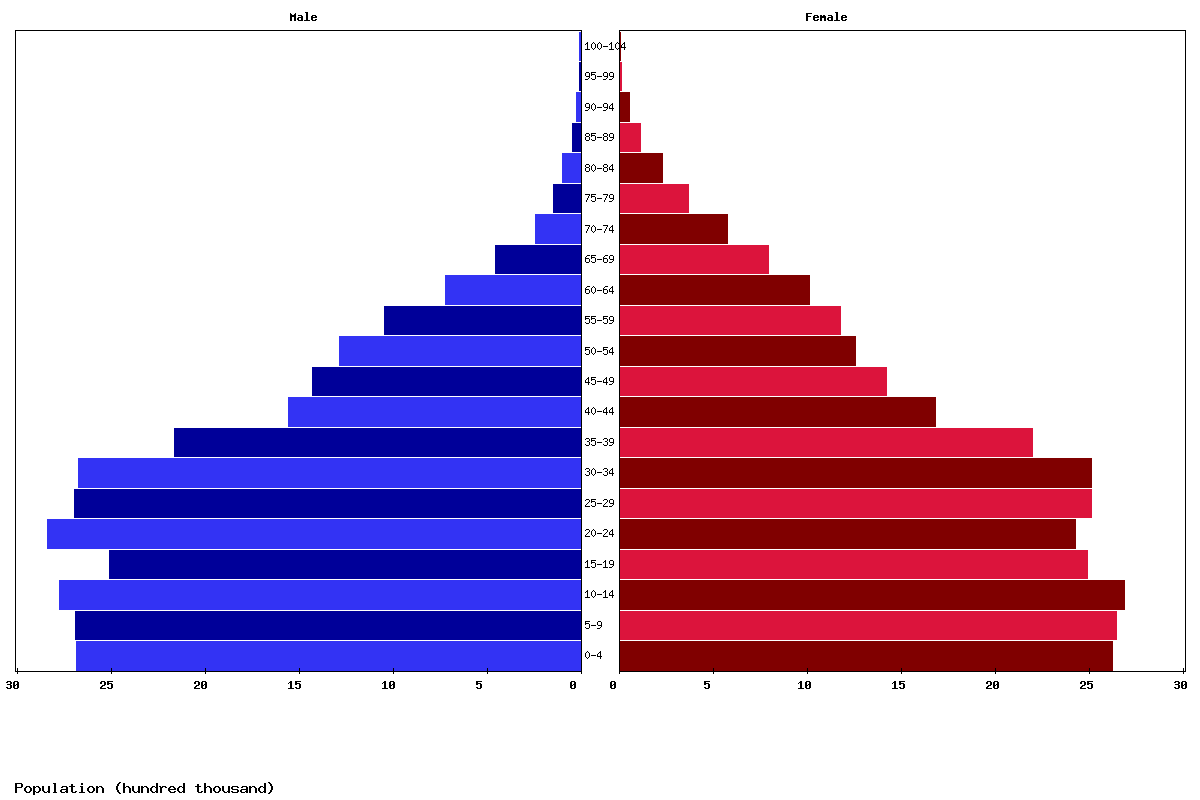
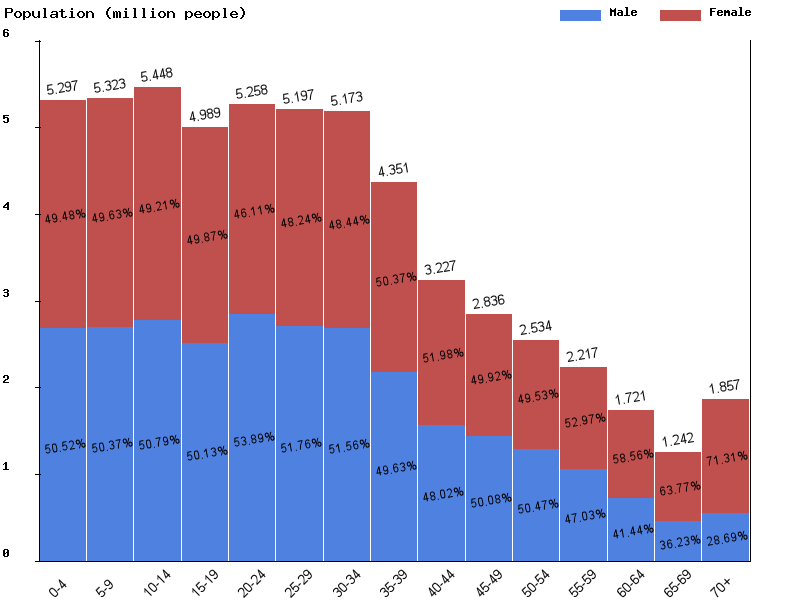
| Age | Both Sexes Population | Male Population | Female Population | Both Sexes (%) | Male (%) | Female (%) | Sex ratio (female/male) |
|---|---|---|---|---|---|---|---|
| Total | 58,436,197 | 28,938,271 | 29,497,926 | 100 | 100 | 100 | 98.1 |
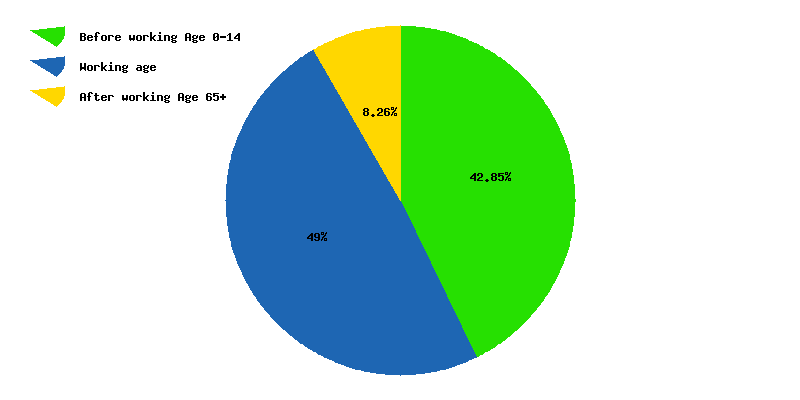
| 00-04 | 5,089,563 | 2,573,922 | 2,515,641 | 8.7 | 8.9 | 8.5 | 102.3 |
| 05-09 | 5,263,064 | 2,655,921 | 2,607,143 | 9 | 9.2 | 8.8 | 101.9 |
| 10-14 | 5,289,059 | 2,661,957 | 2,627,102 | 9.1 | 9.2 | 8.9 | 101.3 |
| 15-19 | 5,383,069 | 2,731,063 | 2,652,006 | 9.2 | 9.4 | 9 | 103 |
| 20-24 | 4,952,008 | 2,480,299 | 2,471,709 | 8.5 | 8.6 | 8.4 | 100.3 |
| 25-29 | 5,172,263 | 2,791,337 | 2,380,926 | 8.9 | 9.6 | 8.1 | 117.2 |
| 30-34 | 5,017,736 | 2,611,067 | 2,406,669 | 8.6 | 9 | 8.2 | 108.5 |
| 35-39 | 4,867,792 | 2,527,965 | 2,339,827 | 8.3 | 8.7 | 7.9 | 108 |
| 40-44 | 4,007,646 | 1,999,904 | 2,007,742 | 6.9 | 6.9 | 6.8 | 99.6 |
| 45-49 | 2,950,251 | 1,415,817 | 1,534,434 | 5 | 4.9 | 5.2 | 92.3 |
| 50-54 | 2,573,657 | 1,278,126 | 1,295,531 | 4.4 | 4.4 | 4.4 | 98.7 |
| 55-59 | 2,288,743 | 1,135,217 | 1,153,526 | 3.9 | 3.9 | 3.9 | 98.4 |
| 60-64 | 1,959,298 | 891,771 | 1,067,527 | 3.4 | 3.1 | 3.6 | 83.5 |
| 65-69 | 1,462,599 | 570,878 | 891,721 | 2.5 | 2 | 3 | 64 |
| 70-74 | 995,402 | 328,632 | 666,770 | 1.7 | 1.1 | 2.3 | 49.3 |
| 75-79 | 598,029 | 151,451 | 446,578 | 1 | 0.5 | 1.5 | 33.9 |
| 80-84 | 326,647 | 77,191 | 249,456 | 0.6 | 0.3 | 0.8 | 30.9 |
| 85-89 | 164,235 | 39,909 | 124,326 | 0.3 | 0.1 | 0.4 | 32.1 |
| 90-94 | 56,650 | 12,419 | 44,231 | 0.1 | 0 | 0.1 | 28.1 |
| 95-99 | 17,319 | 3,273 | 14,046 | 0 | 0 | 0 | 23.3 |
| 100+ | 1,167 | 152 | 1,015 | 0 | 0 | 0 | 15 |
| Year | Population | Yearly % Change |
Yearly Change |
Sex ratio | Density (P/Km²) |
|---|---|---|---|---|---|
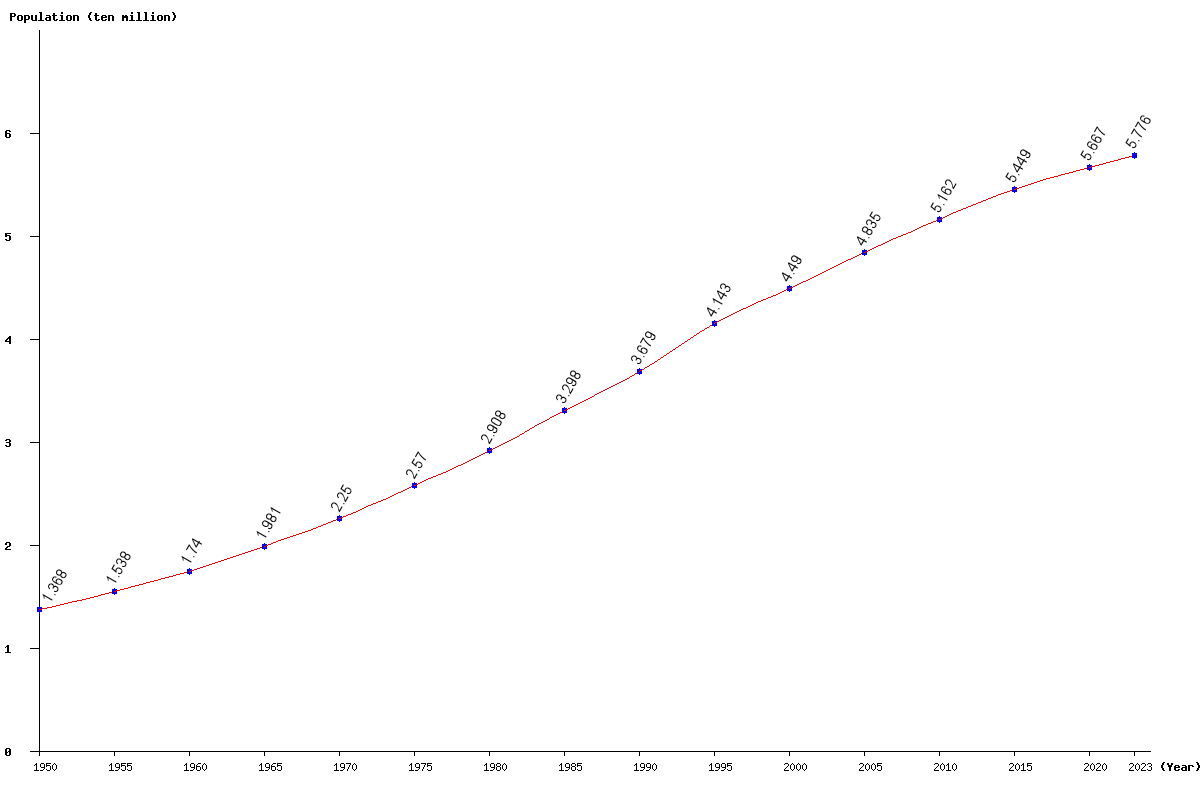
| 2025 | 58,436,197 | 0.58 | 334,143 | 98.10 | 48.17 |
| 2024 | 58,102,054 | 0.59 | 341,492 | 97.97 | 47.90 |
| 2023 | 57,760,562 | 0.61 | 351,020 | 97.83 | 47.61 |
| 2022 | 57,409,542 | 0.64 | 363,158 | 97.69 | 47.33 |
| 2021 | 57,046,384 | 0.67 | 377,782 | 97.55 | 47.03 |
| 2020 | 56,668,602 | 0.70 | 392,744 | 97.41 | 46.71 |
| 2019 | 56,275,858 | 0.73 | 409,147 | 97.27 | 46.39 |
| 2018 | 55,866,711 | 0.78 | 430,351 | 97.14 | 46.05 |
| 2017 | 55,436,360 | 0.83 | 457,453 | 97.01 | 45.70 |
| 2016 | 54,978,907 | 0.90 | 488,501 | 96.89 | 45.32 |
| 2015 | 54,490,406 | 0.97 | 521,352 | 96.76 | 44.92 |
| 2014 | 53,969,054 | 1.03 | 552,445 | 96.64 | 44.49 |
| 2013 | 53,416,609 | 1.10 | 579,335 | 96.52 | 44.03 |
| 2012 | 52,837,274 | 1.15 | 600,002 | 96.42 | 43.56 |
| 2011 | 52,237,272 | 1.19 | 615,678 | 96.33 | 43.06 |
| 2010 | 51,621,594 | 1.23 | 629,560 | 96.28 | 42.55 |
| 2005 | 48,352,951 | 7.70 | 3,456,095 | 96.49 | 39.86 |
| 2000 | 44,896,856 | 8.38 | 3,470,046 | 96.97 | 37.01 |
| 1995 | 41,426,810 | 12.59 | 4,633,320 | 97.10 | 34.15 |
| 1990 | 36,793,490 | 11.55 | 3,810,477 | 97.93 | 30.33 |
| 1985 | 32,983,013 | 13.43 | 3,905,870 | 98.84 | 27.19 |
| 1980 | 29,077,143 | 13.15 | 3,378,287 | 98.96 | 23.97 |
| 1975 | 25,698,856 | 14.20 | 3,196,354 | 99.30 | 21.18 |
| 1970 | 22,502,502 | 13.57 | 2,688,555 | 99.10 | 18.55 |
| 1965 | 19,813,947 | 13.90 | 2,417,580 | 98.82 | 16.33 |
| 1960 | 17,396,367 | 13.08 | 2,011,810 | 99.97 | 14.34 |
| 1955 | 15,384,557 | 12.43 | 1,701,395 | 99.73 | 12.68 |
| 1950 | 13,683,162 | 99.24 | 11.28 |