Singapore population
6,049,230
Births this year: 458,576
Births today 55
Deaths this year 191,073
Deaths today 23
6,049,230
| Region Name | Percents | Number |
|---|---|---|
| Buddhist | 33.9% | 1,960,006 people |
| Muslim | 14.3% | 826,787 people |
| Taoist | 11.3% | 653,335 people |
| Catholic | 7.1% | 410,503 people |
| Hindu | 5.2% | 300,650 people |
| other Christian | 11% | 635,990 people |
| other | 0.7% | 40,472 people |
| none | 16.4% | 948,203 people |
| Ethnic groups Name | Percents | Number |
|---|---|---|
| Chinese | 74.2% | 4,290,042 people |
| Malay | 13.3% | 768,970 people |
| Indian | 9.2% | 531,919 people |
| other | 3.3% | 190,797 people |
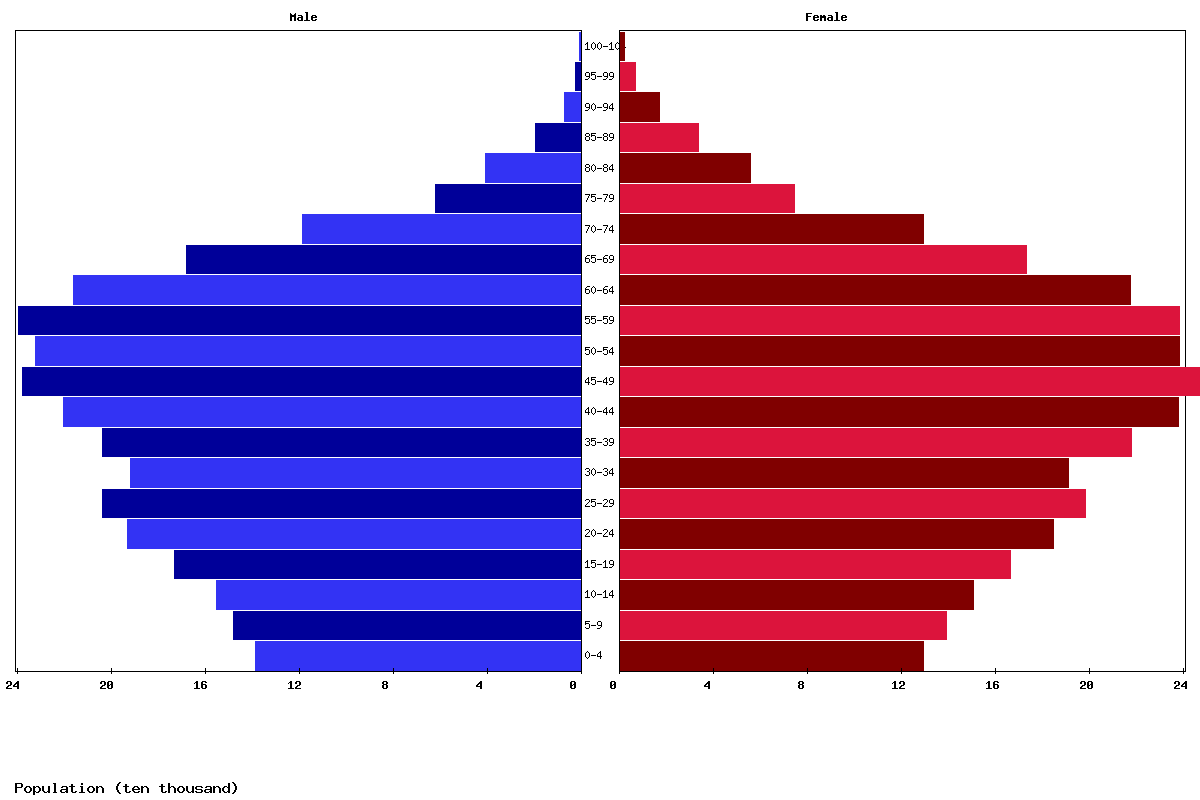
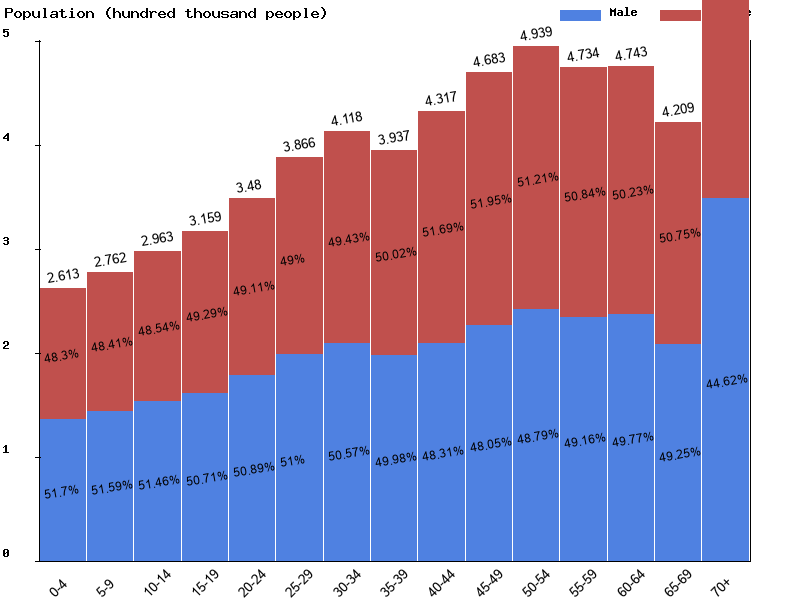
| Age | Both Sexes Population | Male Population | Female Population | Both Sexes (%) | Male (%) | Female (%) | Sex ratio (female/male) |
|---|---|---|---|---|---|---|---|
| Total | 6,231,082 | 3,067,561 | 3,163,521 | 100 | 100 | 100 | 97 |
| 00-04 | 261,270 | 135,068 | 126,202 | 4.2 | 4.4 | 4 | 107 |
| 05-09 | 276,244 | 142,526 | 133,718 | 4.4 | 4.6 | 4.2 | 106.6 |
| 10-14 | 296,304 | 152,472 | 143,832 | 4.8 | 5 | 4.5 | 106 |
| 15-19 | 315,889 | 160,179 | 155,710 | 5.1 | 5.2 | 4.9 | 102.9 |
| 20-24 | 347,962 | 177,061 | 170,901 | 5.6 | 5.8 | 5.4 | 103.6 |
| 25-29 | 386,559 | 197,157 | 189,402 | 6.2 | 6.4 | 6 | 104.1 |
| 30-34 | 411,828 | 208,260 | 203,568 | 6.6 | 6.8 | 6.4 | 102.3 |
| 35-39 | 393,722 | 196,764 | 196,958 | 6.3 | 6.4 | 6.2 | 99.9 |
| 40-44 | 431,688 | 208,529 | 223,159 | 6.9 | 6.8 | 7.1 | 93.4 |
| 45-49 | 468,301 | 225,028 | 243,273 | 7.5 | 7.3 | 7.7 | 92.5 |
| 50-54 | 493,939 | 240,984 | 252,955 | 7.9 | 7.9 | 8 | 95.3 |
| 55-59 | 473,402 | 232,722 | 240,680 | 7.6 | 7.6 | 7.6 | 96.7 |
| 60-64 | 474,261 | 236,037 | 238,224 | 7.6 | 7.7 | 7.5 | 99.1 |
| 65-69 | 420,873 | 207,268 | 213,605 | 6.8 | 6.8 | 6.8 | 97 |
| 70-74 | 322,643 | 155,754 | 166,889 | 5.2 | 5.1 | 5.3 | 93.3 |
| 75-79 | 223,909 | 103,592 | 120,317 | 3.6 | 3.4 | 3.8 | 86.1 |
| 80-84 | 112,613 | 48,197 | 64,416 | 1.8 | 1.6 | 2 | 74.8 |
| 85-89 | 69,809 | 26,508 | 43,301 | 1.1 | 0.9 | 1.4 | 61.2 |
| 90-94 | 33,384 | 10,227 | 23,157 | 0.5 | 0.3 | 0.7 | 44.2 |
| 95-99 | 12,561 | 2,697 | 9,864 | 0.2 | 0.1 | 0.3 | 27.3 |
| 100+ | 3,921 | 531 | 3,390 | 0.1 | 0 | 0.1 | 15.7 |
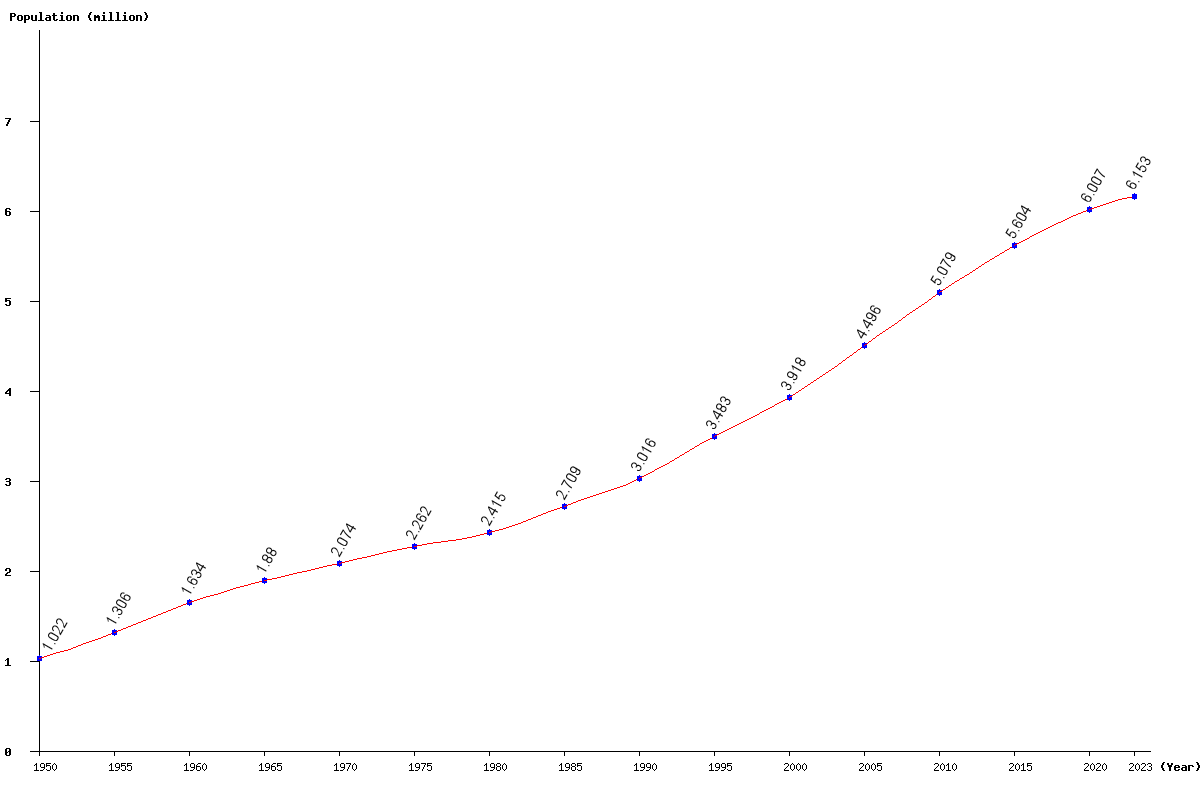
| Year | Population | Yearly % Change |
Yearly Change |
Sex ratio | Density (P/Km²) |
|---|---|---|---|---|---|
| 2024 | 6,192,455 | 0.64 | 39,111 | 97.03 | 8,846.36 |
| 2023 | 6,153,344 | 0.69 | 41,989 | 97.10 | 8,790.49 |
| 2022 | 6,111,355 | 0.79 | 48,104 | 97.16 | 8,730.51 |
| 2021 | 6,063,251 | 0.94 | 56,541 | 97.22 | 8,661.79 |
| 2020 | 6,006,710 | 1.11 | 65,785 | 97.26 | 8,581.01 |
| 2019 | 5,940,925 | 1.27 | 74,378 | 97.31 | 8,487.04 |
| 2018 | 5,866,547 | 1.42 | 82,009 | 97.35 | 8,380.78 |
| 2017 | 5,784,538 | 1.55 | 88,032 | 97.38 | 8,263.63 |
| 2016 | 5,696,506 | 1.66 | 92,766 | 97.40 | 8,137.87 |
| 2015 | 5,603,740 | 1.76 | 97,154 | 97.40 | 8,005.34 |
| 2014 | 5,506,586 | 1.88 | 101,577 | 97.39 | 7,866.55 |
| 2013 | 5,405,009 | 1.99 | 105,485 | 97.36 | 7,721.44 |
| 2012 | 5,299,524 | 2.10 | 108,858 | 97.34 | 7,570.75 |
| 2011 | 5,190,666 | 2.20 | 111,705 | 97.35 | 7,415.24 |
| 2010 | 5,078,961 | 2.29 | 113,856 | 97.41 | 7,255.66 |
| 2005 | 4,495,531 | 14.74 | 577,348 | 98.54 | 6,422.19 |
| 2000 | 3,918,183 | 12.51 | 435,548 | 99.84 | 5,597.40 |
| 1995 | 3,482,635 | 15.46 | 466,235 | 101.35 | 4,975.19 |
| 1990 | 3,016,400 | 11.36 | 307,766 | 101.25 | 4,309.14 |
| 1985 | 2,708,634 | 12.18 | 294,110 | 103.78 | 3,869.48 |
| 1980 | 2,414,524 | 6.72 | 152,131 | 104.13 | 3,449.32 |
| 1975 | 2,262,393 | 9.08 | 188,322 | 104.44 | 3,231.99 |
| 1970 | 2,074,071 | 10.35 | 194,500 | 104.91 | 2,962.96 |
| 1965 | 1,879,571 | 15.05 | 245,853 | 106.49 | 2,685.10 |
| 1960 | 1,633,718 | 25.12 | 327,987 | 111.32 | 2,333.88 |
| 1955 | 1,305,731 | 27.75 | 283,633 | 110.96 | 1,865.33 |
| 1950 | 1,022,098 | 107.41 | 1,460.14 |