Senegal population
14,320,055
Births this year: 0
Births today 0
Deaths this year 0
Deaths today 0
14,320,055
| Region Name | Percents | Number |
|---|---|---|
| Muslim (most adhere to one of the four main Sufi brotherhoods) | 94% | 13,460,852 people |
| Christian (mostly Roman Catholic) | 5% | 716,003 people |
| indigenous beliefs | 1% | 143,201 people |
| Ethnic groups Name | Percents | Number |
|---|---|---|
| Wolof | 43.3% | 6,200,584 people |
| Pular | 23.8% | 3,408,173 people |
| Serer | 14.7% | 2,105,048 people |
| Jola | 3.7% | 529,842 people |
| Mandinka | 3% | 429,602 people |
| Soninke | 1.1% | 157,521 people |
| European and Lebanese | 1% | 143,201 people |
| other | 9.4% | 1,346,085 people |
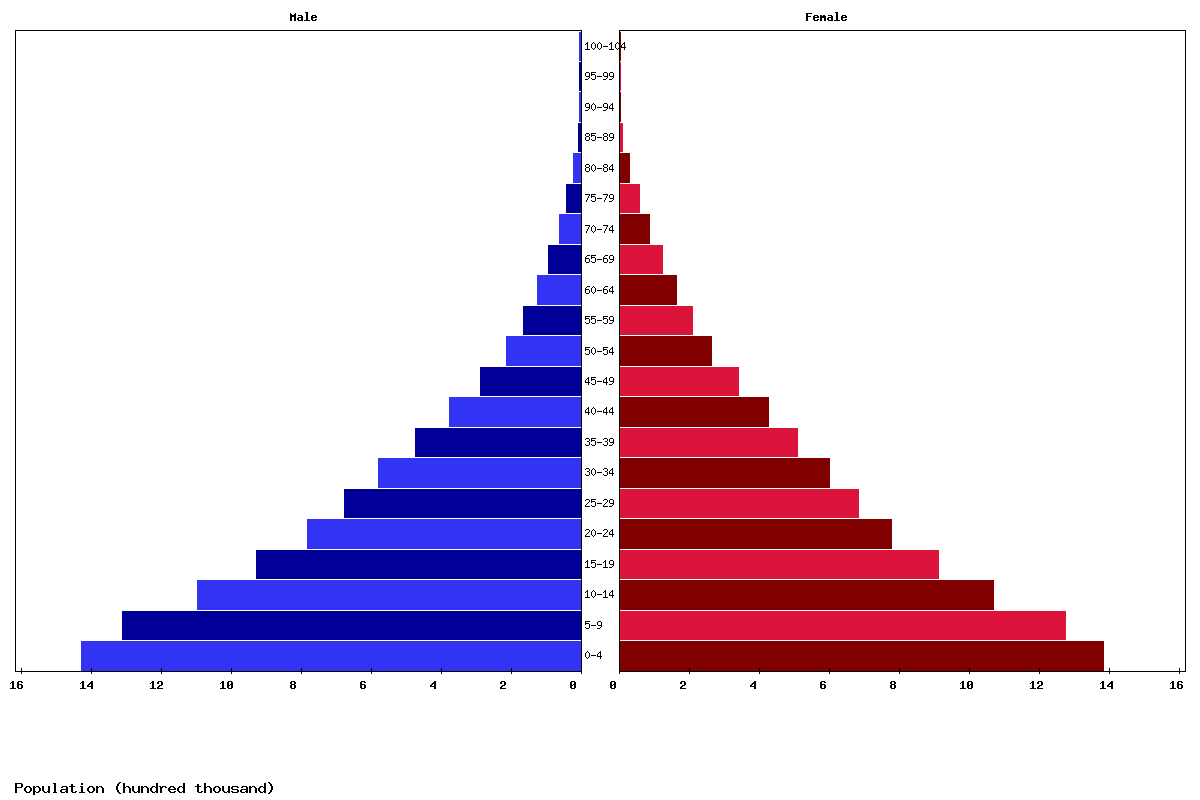
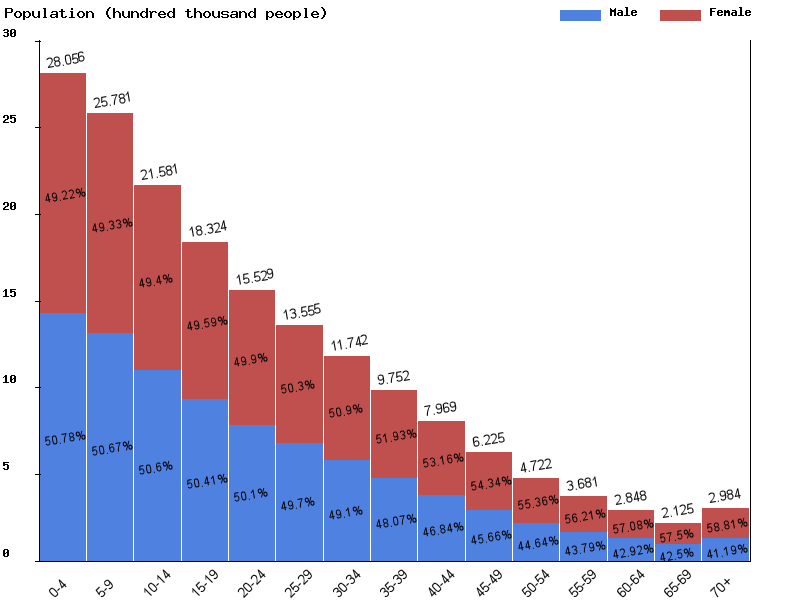
| Age | Both Sexes Population | Male Population | Female Population | Both Sexes (%) | Male (%) | Female (%) | Sex ratio (female/male) |
|---|---|---|---|---|---|---|---|
| Total | 20,036,744 | 9,886,306 | 10,150,438 | 100 | 100 | 100 | 97.4 |
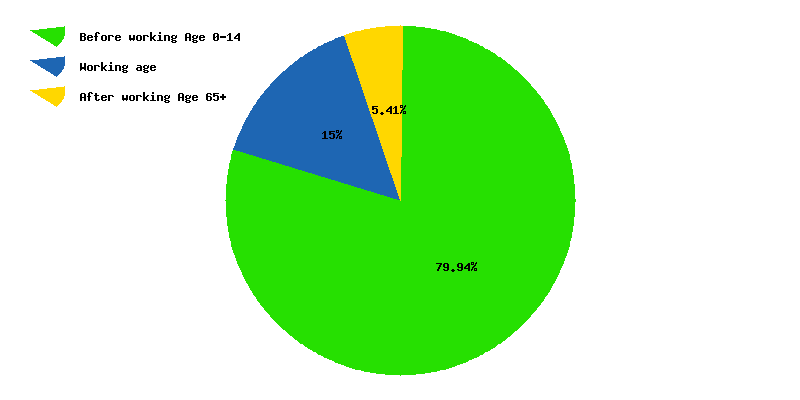
| 00-04 | 3,017,302 | 1,534,551 | 1,482,751 | 15.1 | 15.5 | 14.6 | 103.5 |
| 05-09 | 2,785,933 | 1,414,487 | 1,371,446 | 13.9 | 14.3 | 13.5 | 103.1 |
| 10-14 | 2,565,796 | 1,299,372 | 1,266,424 | 12.8 | 13.1 | 12.5 | 102.6 |
| 15-19 | 2,142,523 | 1,082,575 | 1,059,948 | 10.7 | 11 | 10.4 | 102.1 |
| 20-24 | 1,804,488 | 906,036 | 898,452 | 9 | 9.2 | 8.9 | 100.8 |
| 25-29 | 1,520,292 | 757,274 | 763,018 | 7.6 | 7.7 | 7.5 | 99.2 |
| 30-34 | 1,325,869 | 654,894 | 670,975 | 6.6 | 6.6 | 6.6 | 97.6 |
| 35-39 | 1,148,651 | 560,379 | 588,272 | 5.7 | 5.7 | 5.8 | 95.3 |
| 40-44 | 952,548 | 454,710 | 497,838 | 4.8 | 4.6 | 4.9 | 91.3 |
| 45-49 | 775,430 | 360,107 | 415,323 | 3.9 | 3.6 | 4.1 | 86.7 |
| 50-54 | 600,940 | 271,233 | 329,707 | 3 | 2.7 | 3.2 | 82.3 |
| 55-59 | 449,565 | 197,461 | 252,104 | 2.2 | 2 | 2.5 | 78.3 |
| 60-64 | 342,294 | 146,602 | 195,692 | 1.7 | 1.5 | 1.9 | 74.9 |
| 65-69 | 254,067 | 105,993 | 148,074 | 1.3 | 1.1 | 1.5 | 71.6 |
| 70-74 | 175,507 | 71,955 | 103,552 | 0.9 | 0.7 | 1 | 69.5 |
| 75-79 | 102,238 | 40,494 | 61,744 | 0.5 | 0.4 | 0.6 | 65.6 |
| 80-84 | 52,674 | 20,557 | 32,117 | 0.3 | 0.2 | 0.3 | 64 |
| 85-89 | 17,276 | 6,478 | 10,798 | 0.1 | 0.1 | 0.1 | 60 |
| 90-94 | 3,064 | 1,059 | 2,005 | 0 | 0 | 0 | 52.8 |
| 95-99 | 273 | 85 | 188 | 0 | 0 | 0 | 45.2 |
| 100+ | 14 | 4 | 10 | 0 | 0 | 0 | 40 |
| Year | Population | Yearly % Change |
Yearly Change |
Sex ratio | Density (P/Km²) |
|---|---|---|---|---|---|
| 2025 | 20,036,744 | 2.70 | 526,168 | 97.40 | 104.07 |
| 2024 | 19,510,576 | 2.73 | 517,773 | 97.31 | 101.34 |
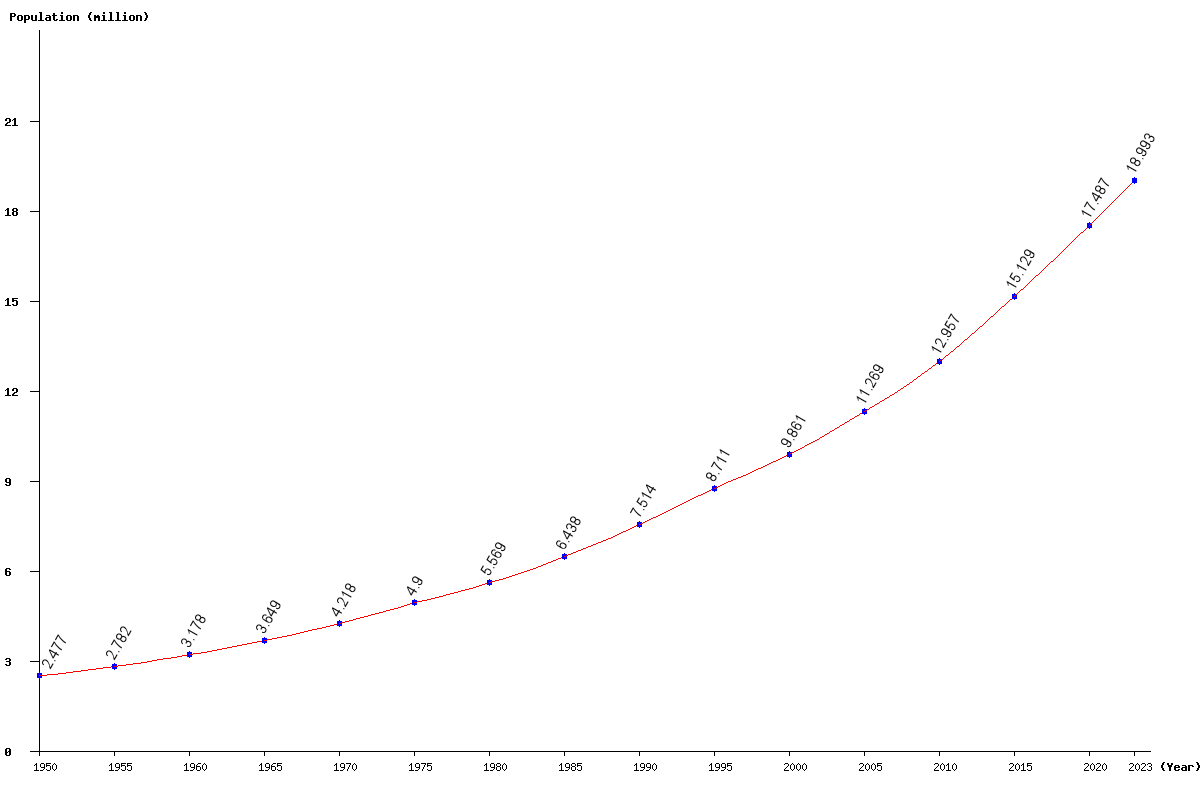
| 2023 | 18,992,803 | 2.76 | 509,627 | 97.23 | 98.65 |
| 2022 | 18,483,176 | 2.79 | 501,729 | 97.14 | 96.00 |
| 2021 | 17,981,447 | 2.83 | 494,038 | 97.05 | 93.40 |
| 2020 | 17,487,409 | 2.86 | 485,703 | 96.96 | 90.83 |
| 2019 | 17,001,706 | 2.89 | 477,277 | 96.86 | 88.31 |
| 2018 | 16,524,429 | 2.93 | 470,154 | 96.77 | 85.83 |
| 2017 | 16,054,275 | 2.98 | 464,790 | 96.68 | 83.39 |
| 2016 | 15,589,485 | 3.04 | 460,212 | 96.58 | 80.97 |
| 2015 | 15,129,273 | 3.11 | 456,716 | 96.47 | 78.58 |
| 2014 | 14,672,557 | 3.17 | 451,516 | 96.35 | 76.21 |
| 2013 | 14,221,041 | 3.20 | 440,933 | 96.22 | 73.86 |
| 2012 | 13,780,108 | 3.17 | 423,105 | 96.10 | 71.57 |
| 2011 | 13,357,003 | 3.09 | 400,212 | 96.00 | 69.38 |
| 2010 | 12,956,791 | 2.98 | 375,167 | 95.94 | 67.30 |
| 2005 | 11,268,994 | 14.28 | 1,408,416 | 96.26 | 58.53 |
| 2000 | 9,860,578 | 13.20 | 1,149,832 | 96.91 | 51.22 |
| 1995 | 8,710,746 | 15.92 | 1,196,545 | 98.60 | 45.24 |
| 1990 | 7,514,201 | 16.72 | 1,076,177 | 99.10 | 39.03 |
| 1985 | 6,438,024 | 15.61 | 869,373 | 99.57 | 33.44 |
| 1980 | 5,568,651 | 13.63 | 668,160 | 100.31 | 28.92 |
| 1975 | 4,900,491 | 16.19 | 682,737 | 102.01 | 25.45 |
| 1970 | 4,217,754 | 15.58 | 568,446 | 101.35 | 21.91 |
| 1965 | 3,649,308 | 14.85 | 471,748 | 99.97 | 18.95 |
| 1960 | 3,177,560 | 14.22 | 395,605 | 98.72 | 16.50 |
| 1955 | 2,781,955 | 12.33 | 305,317 | 97.17 | 14.45 |
| 1950 | 2,476,638 | 95.34 | 12.86 |