Sao Tome and Principe population
197,541
Births this year: 0
Births today 0
Deaths this year 0
Deaths today 0
197,541
| Region Name | Percents | Number |
|---|---|---|
| Catholic | 55.7% | 110,030 people |
| Adventist | 4.1% | 8,099 people |
| Assembly of God | 3.4% | 6,716 people |
| New Apostolic | 2.9% | 5,729 people |
| Mana | 2.3% | 4,543 people |
| Universal Kingdom of God | 2% | 3,951 people |
| other | 29.6% | 58,472 people |
| Ethnic groups Name | Percents | Number |
|---|---|---|
| mestico, angolares (descendants of Angolan slaves), forros (descendants of freed slaves), servicais (contract laborers from Angola, Mozambique, and Cabo Verde), tongas (children of servicais born on the islands), Europeans (primarily Portuguese), Asians (mostly Chinese) | 0 people |
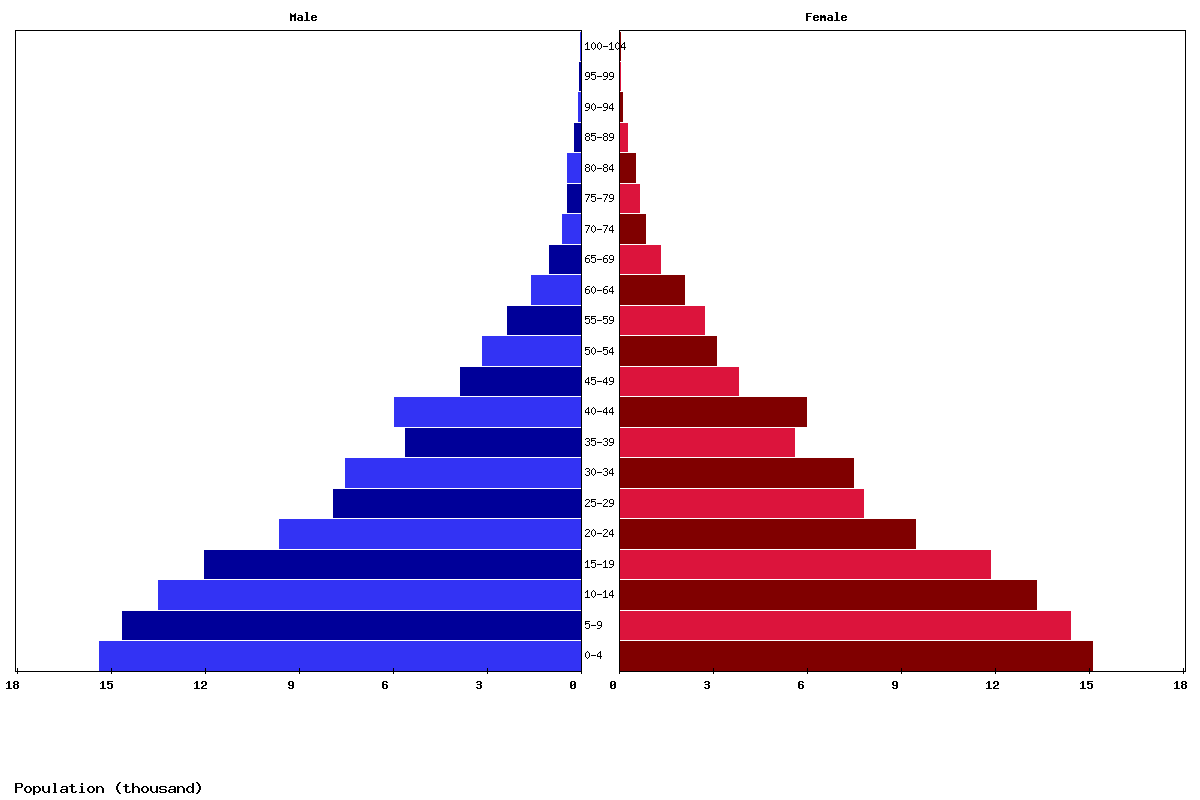
| Age | Both Sexes Population | Male Population | Female Population | Both Sexes (%) | Male (%) | Female (%) | Sex ratio (female/male) |
|---|---|---|---|---|---|---|---|
| Total | 232,982 | 116,075 | 116,907 | 100 | 100 | 100 | 99.3 |
| 00-04 | 31,694 | 15,987 | 15,707 | 13.6 | 13.8 | 13.4 | 101.8 |
| 05-09 | 29,843 | 15,021 | 14,822 | 12.8 | 12.9 | 12.7 | 101.3 |
| 10-14 | 28,691 | 14,433 | 14,258 | 12.3 | 12.4 | 12.2 | 101.2 |
| 15-19 | 26,047 | 13,107 | 12,940 | 11.2 | 11.3 | 11.1 | 101.3 |
| 20-24 | 22,640 | 11,386 | 11,254 | 9.7 | 9.8 | 9.6 | 101.2 |
| 25-29 | 17,903 | 9,000 | 8,903 | 7.7 | 7.8 | 7.6 | 101.1 |
| 30-34 | 14,760 | 7,403 | 7,357 | 6.3 | 6.4 | 6.3 | 100.6 |
| 35-39 | 14,256 | 7,113 | 7,143 | 6.1 | 6.1 | 6.1 | 99.6 |
| 40-44 | 10,660 | 5,307 | 5,353 | 4.6 | 4.6 | 4.6 | 99.1 |
| 45-49 | 11,398 | 5,664 | 5,734 | 4.9 | 4.9 | 4.9 | 98.8 |
| 50-54 | 7,233 | 3,594 | 3,639 | 3.1 | 3.1 | 3.1 | 98.8 |
| 55-59 | 5,850 | 2,911 | 2,939 | 2.5 | 2.5 | 2.5 | 99 |
| 60-64 | 4,643 | 2,113 | 2,530 | 2 | 1.8 | 2.2 | 83.5 |
| 65-69 | 3,213 | 1,350 | 1,863 | 1.4 | 1.2 | 1.6 | 72.5 |
| 70-74 | 1,908 | 797 | 1,111 | 0.8 | 0.7 | 1 | 71.7 |
| 75-79 | 1,019 | 397 | 622 | 0.4 | 0.3 | 0.5 | 63.8 |
| 80-84 | 636 | 243 | 393 | 0.3 | 0.2 | 0.3 | 61.8 |
| 85-89 | 430 | 186 | 244 | 0.2 | 0.2 | 0.2 | 76.2 |
| 90-94 | 133 | 54 | 79 | 0.1 | 0 | 0.1 | 68.4 |
| 95-99 | 23 | 8 | 15 | 0 | 0 | 0 | 53.3 |
| 100+ | 2 | 1 | 1 | 0 | 0 | 0 | 100 |
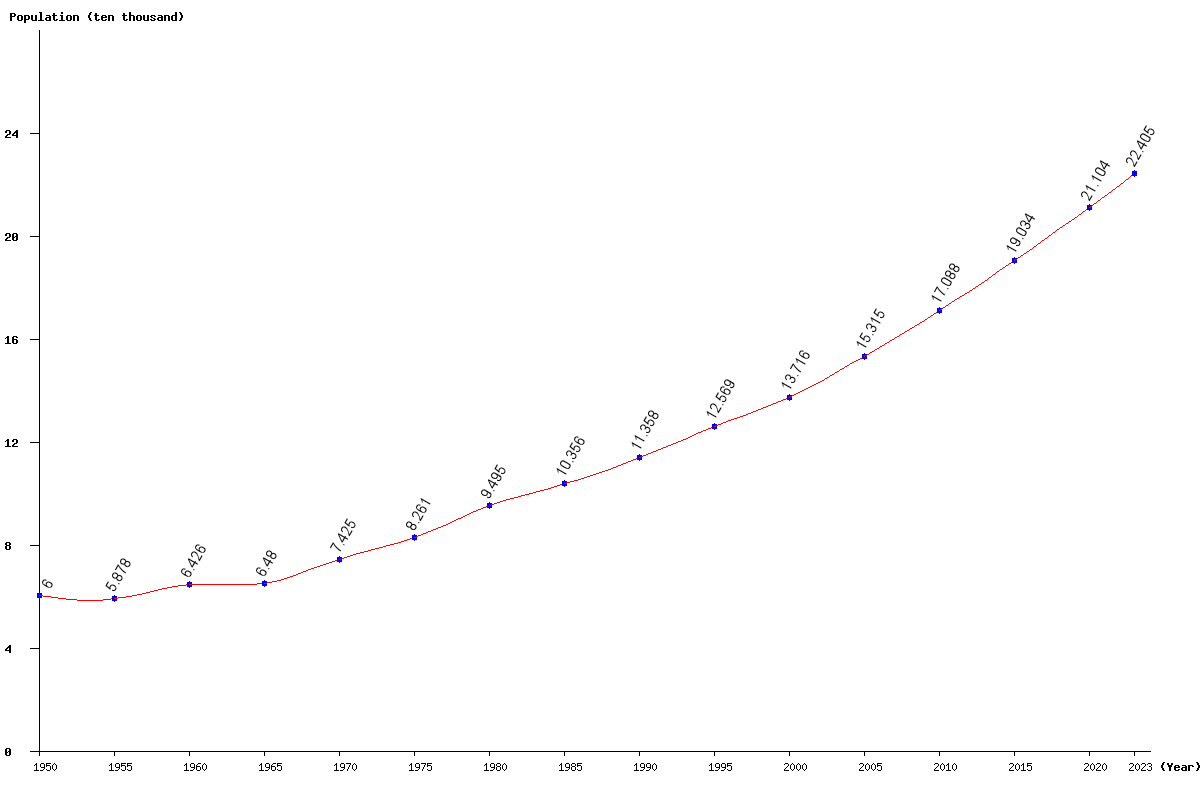
| Year | Population | Yearly % Change |
Yearly Change |
Sex ratio | Density (P/Km²) |
|---|---|---|---|---|---|
| 2025 | 232,982 | 1.97 | 4,497 | 99.29 | 242.69 |
| 2024 | 228,485 | 1.98 | 4,440 | 99.28 | 238.01 |
| 2023 | 224,045 | 2.00 | 4,385 | 99.27 | 233.38 |
| 2022 | 219,660 | 2.01 | 4,334 | 99.26 | 228.81 |
| 2021 | 215,326 | 2.03 | 4,287 | 99.25 | 224.30 |
| 2020 | 211,039 | 2.05 | 4,237 | 99.24 | 219.83 |
| 2019 | 206,802 | 2.07 | 4,185 | 99.22 | 215.42 |
| 2018 | 202,617 | 2.08 | 4,136 | 99.20 | 211.06 |
| 2017 | 198,481 | 2.10 | 4,091 | 99.18 | 206.75 |
| 2016 | 194,390 | 2.13 | 4,046 | 99.16 | 202.49 |
| 2015 | 190,344 | 2.15 | 4,002 | 99.14 | 198.28 |
| 2014 | 186,342 | 2.17 | 3,956 | 99.11 | 194.11 |
| 2013 | 182,386 | 2.19 | 3,902 | 99.08 | 189.99 |
| 2012 | 178,484 | 2.20 | 3,838 | 99.05 | 185.92 |
| 2011 | 174,646 | 2.20 | 3,766 | 99.02 | 181.92 |
| 2010 | 170,880 | 2.20 | 3,684 | 98.98 | 178.00 |
| 2005 | 153,146 | 11.65 | 15,982 | 98.79 | 159.53 |
| 2000 | 137,164 | 9.13 | 11,470 | 98.56 | 142.88 |
| 1995 | 125,694 | 10.67 | 12,119 | 98.36 | 130.93 |
| 1990 | 113,575 | 9.67 | 10,018 | 98.08 | 118.31 |
| 1985 | 103,557 | 9.06 | 8,604 | 97.76 | 107.87 |
| 1980 | 94,953 | 14.95 | 12,346 | 97.40 | 98.91 |
| 1975 | 82,607 | 11.25 | 8,356 | 98.98 | 86.05 |
| 1970 | 74,251 | 14.59 | 9,454 | 100.49 | 77.34 |
| 1965 | 64,797 | 0.84 | 542 | 111.56 | 67.50 |
| 1960 | 64,255 | 9.31 | 5,473 | 125.38 | 66.93 |
| 1955 | 58,782 | -2.03 | -1,218 | 124.89 | 61.23 |
| 1950 | 60,000 | 124.89 | 62.50 |