Saint Vincent and the Grenadines population
108,568
Births this year: 13,659
Births today 1
Deaths this year 7,441
Deaths today 0
108,568
| Region Name | Percents | Number |
|---|---|---|
| Protestant (Anglican, Methodist) | 75% | 76,763 people |
| Roman Catholic | 13% | 13,306 people |
| other (includes Hindu, Seventh-Day Adventist, other Protestant) | 12% | 12,282 people |
| Ethnic groups Name | Percents | Number |
|---|---|---|
| black | 66% | 67,551 people |
| mixed | 19% | 19,447 people |
| East Indian | 6% | 6,141 people |
| European | 4% | 4,094 people |
| Carib Amerindian | 2% | 2,047 people |
| other | 3% | 3,071 people |
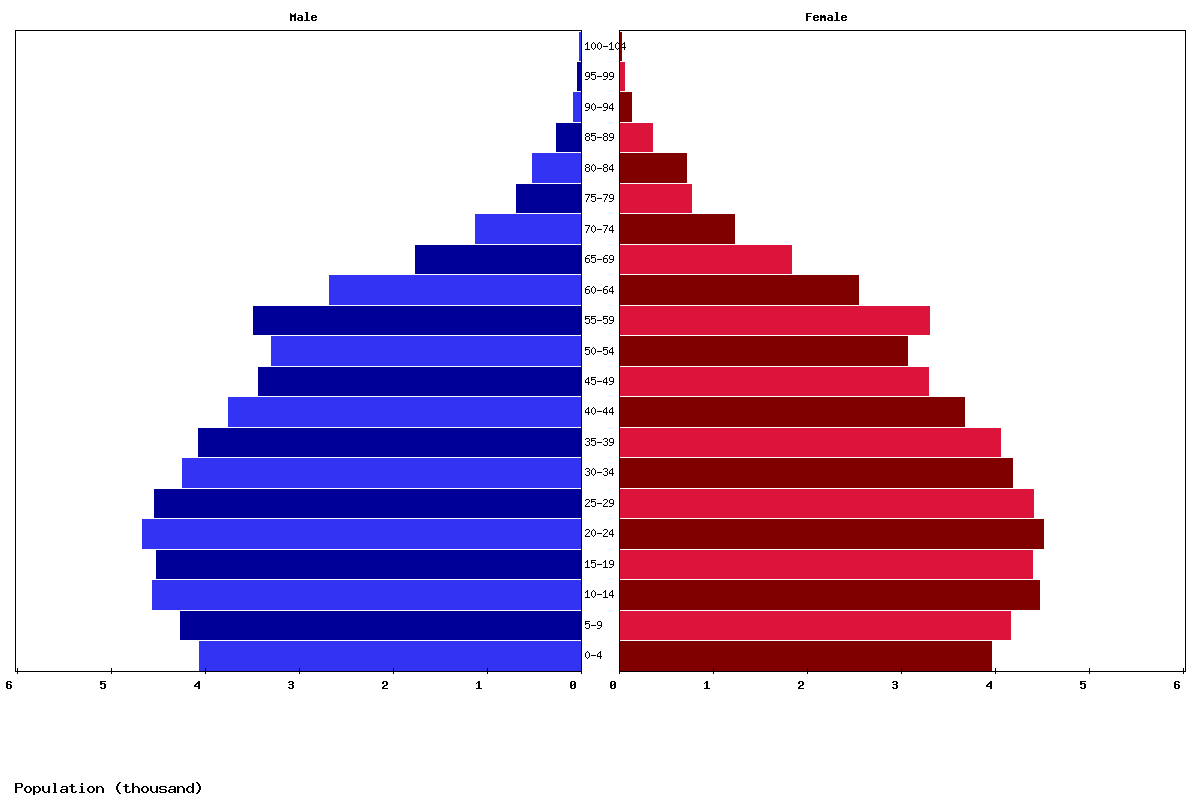
| Age | Both Sexes Population | Male Population | Female Population | Both Sexes (%) | Male (%) | Female (%) | Sex ratio (female/male) |
|---|---|---|---|---|---|---|---|
| Total | 111,606 | 56,100 | 55,506 | 100 | 100 | 100 | 101.1 |
| 00-04 | 7,454 | 3,770 | 3,684 | 6.7 | 6.7 | 6.6 | 102.3 |
| 05-09 | 7,913 | 3,999 | 3,914 | 7.1 | 7.1 | 7.1 | 102.2 |
| 10-14 | 8,332 | 4,212 | 4,120 | 7.5 | 7.5 | 7.4 | 102.2 |
| 15-19 | 8,717 | 4,410 | 4,307 | 7.8 | 7.9 | 7.8 | 102.4 |
| 20-24 | 8,381 | 4,257 | 4,124 | 7.5 | 7.6 | 7.4 | 103.2 |
| 25-29 | 8,653 | 4,395 | 4,258 | 7.8 | 7.8 | 7.7 | 103.2 |
| 30-34 | 8,508 | 4,304 | 4,204 | 7.6 | 7.7 | 7.6 | 102.4 |
| 35-39 | 8,056 | 4,031 | 4,025 | 7.2 | 7.2 | 7.3 | 100.1 |
| 40-44 | 7,800 | 3,883 | 3,917 | 7 | 6.9 | 7.1 | 99.1 |
| 45-49 | 7,133 | 3,583 | 3,550 | 6.4 | 6.4 | 6.4 | 100.9 |
| 50-54 | 6,445 | 3,267 | 3,178 | 5.8 | 5.8 | 5.7 | 102.8 |
| 55-59 | 6,075 | 3,134 | 2,941 | 5.4 | 5.6 | 5.3 | 106.6 |
| 60-64 | 6,395 | 3,268 | 3,127 | 5.7 | 5.8 | 5.6 | 104.5 |
| 65-69 | 4,740 | 2,393 | 2,347 | 4.2 | 4.3 | 4.2 | 102 |
| 70-74 | 3,073 | 1,464 | 1,609 | 2.8 | 2.6 | 2.9 | 91 |
| 75-79 | 1,847 | 851 | 996 | 1.7 | 1.5 | 1.8 | 85.4 |
| 80-84 | 1,006 | 452 | 554 | 0.9 | 0.8 | 1 | 81.6 |
| 85-89 | 722 | 289 | 433 | 0.6 | 0.5 | 0.8 | 66.7 |
| 90-94 | 277 | 110 | 167 | 0.2 | 0.2 | 0.3 | 65.9 |
| 95-99 | 62 | 22 | 40 | 0.1 | 0 | 0.1 | 55 |
| 100+ | 17 | 6 | 11 | 0 | 0 | 0 | 54.5 |
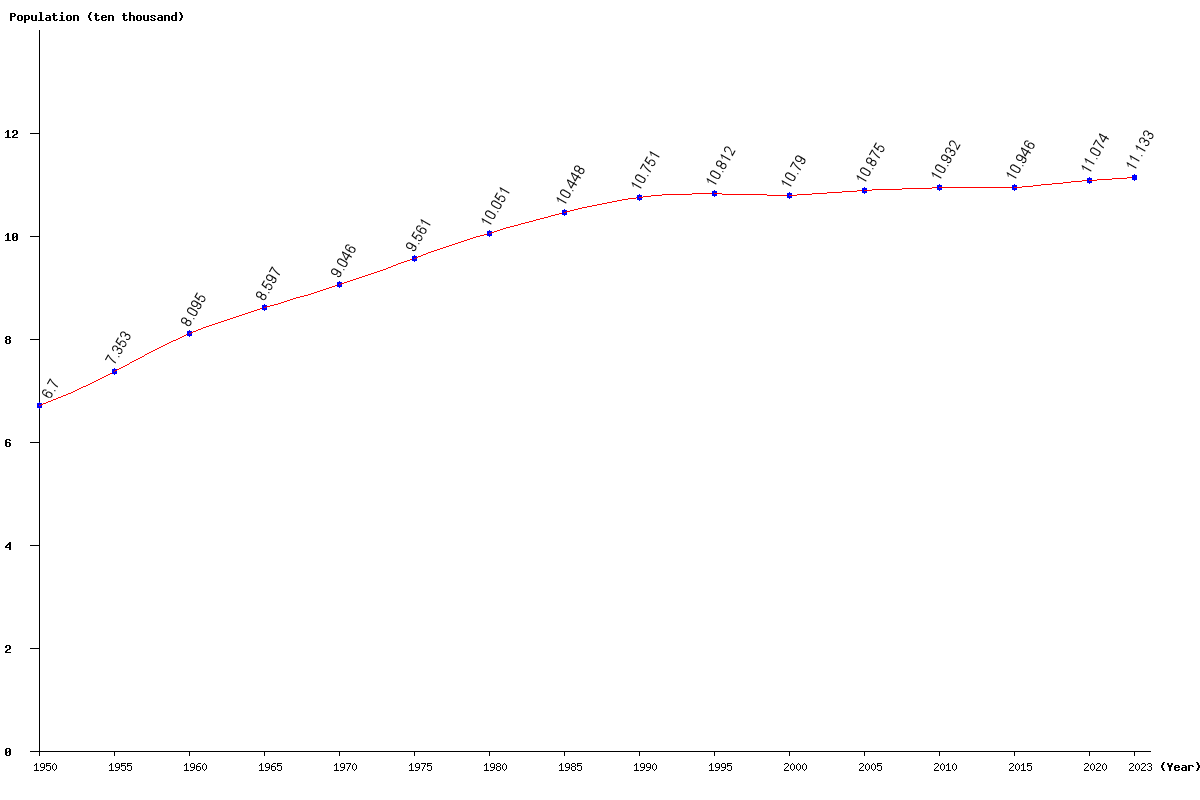
| Year | Population | Yearly % Change |
Yearly Change |
Sex ratio | Density (P/Km²) |
|---|---|---|---|---|---|
| 2025 | 111,606 | 0.12 | 134 | 101.07 | 286.17 |
| 2024 | 111,472 | 0.13 | 147 | 101.17 | 285.83 |
| 2023 | 111,325 | 0.15 | 166 | 101.27 | 285.45 |
| 2022 | 111,159 | 0.17 | 193 | 101.36 | 285.02 |
| 2021 | 110,966 | 0.20 | 225 | 101.45 | 284.53 |
| 2020 | 110,741 | 0.24 | 263 | 101.53 | 283.95 |
| 2019 | 110,478 | 0.27 | 292 | 101.60 | 283.28 |
| 2018 | 110,186 | 0.26 | 291 | 101.67 | 282.53 |
| 2017 | 109,895 | 0.23 | 251 | 101.74 | 281.78 |
| 2016 | 109,644 | 0.17 | 182 | 101.80 | 281.14 |
| 2015 | 109,462 | 0.09 | 102 | 101.85 | 280.67 |
| 2014 | 109,360 | 0.03 | 33 | 101.89 | 280.41 |
| 2013 | 109,327 | -0.01 | -7 | 101.93 | 280.33 |
| 2012 | 109,334 | -0.01 | -7 | 101.96 | 280.34 |
| 2011 | 109,341 | 0.02 | 25 | 101.98 | 280.36 |
| 2010 | 109,316 | 0.06 | 61 | 102.01 | 280.30 |
| 2005 | 108,749 | 0.79 | 852 | 102.01 | 278.84 |
| 2000 | 107,897 | -0.21 | -225 | 101.43 | 276.66 |
| 1995 | 108,122 | 0.57 | 613 | 100.28 | 277.24 |
| 1990 | 107,509 | 2.90 | 3,032 | 98.87 | 275.66 |
| 1985 | 104,477 | 3.95 | 3,971 | 96.05 | 267.89 |
| 1980 | 100,506 | 5.12 | 4,892 | 93.91 | 257.71 |
| 1975 | 95,614 | 5.70 | 5,157 | 91.23 | 245.16 |
| 1970 | 90,457 | 5.22 | 4,485 | 89.75 | 231.94 |
| 1965 | 85,972 | 6.21 | 5,024 | 88.06 | 220.44 |
| 1960 | 80,948 | 10.09 | 7,420 | 88.26 | 207.56 |
| 1955 | 73,528 | 9.74 | 6,528 | 88.61 | 188.53 |
| 1950 | 67,000 | 88.85 | 171.79 |