Rwanda population
1,266,498
Births this year: 0
Births today 0
Deaths this year 32,344
Deaths today 6
1,266,498
| Region Name | Percents | Number |
|---|---|---|
| Roman Catholic | 49.5% | 642,927 people |
| Protestant (includes Adventist and other Protestant) | 39.4% | 511,744 people |
| other Christian | 4.5% | 58,448 people |
| Muslim | 1.8% | 23,379 people |
| animist | 0.1% | 1,299 people |
| other | 0.6% | 7,793 people |
| none | 3.6% | 46,758 people |
| unspecified | 0.5% | 6,494 people |
| Ethnic groups Name | Percents | Number |
|---|---|---|
| Hutu (Bantu) | 84% | 1,091,027 people |
| Tutsi (Hamitic) | 15% | 194,826 people |
| Twa (Pygmy) | 1% | 12,988 people |
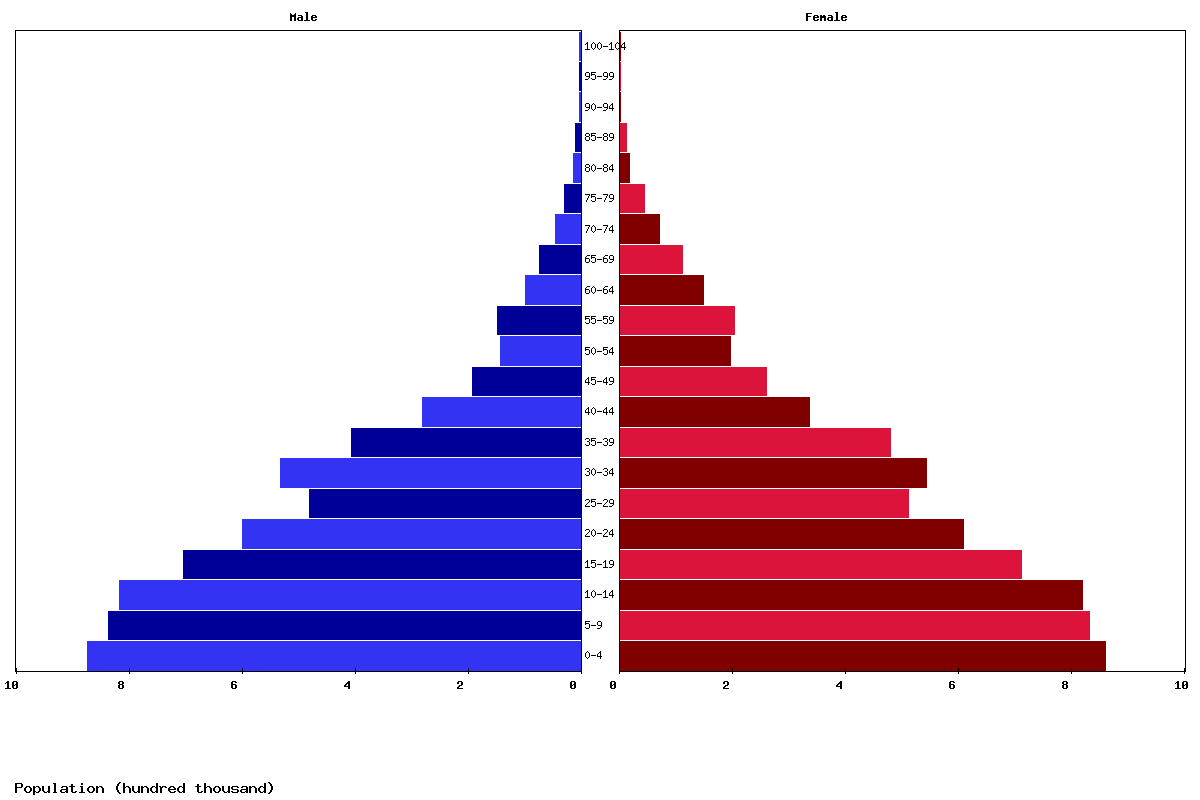
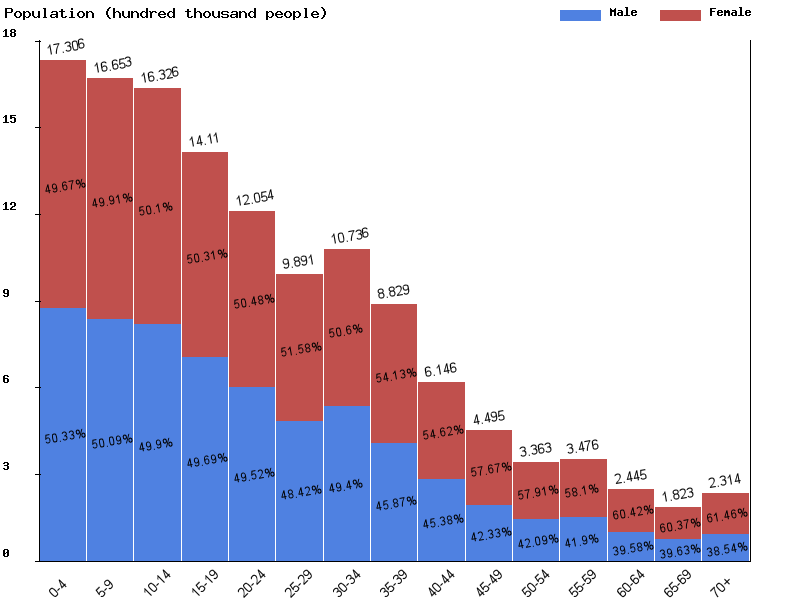
| Age | Both Sexes Population | Male Population | Female Population | Both Sexes (%) | Male (%) | Female (%) | Sex ratio (female/male) |
|---|---|---|---|---|---|---|---|
| Total | 14,377,389 | 6,932,968 | 7,444,421 | 100 | 100 | 100 | 93.1 |
| 00-04 | 1,740,843 | 878,903 | 861,940 | 12.1 | 12.7 | 11.6 | 102 |
| 05-09 | 1,708,443 | 858,231 | 850,212 | 11.9 | 12.4 | 11.4 | 100.9 |
| 10-14 | 1,655,264 | 828,284 | 826,980 | 11.5 | 11.9 | 11.1 | 100.2 |
| 15-19 | 1,617,624 | 805,584 | 812,040 | 11.3 | 11.6 | 10.9 | 99.2 |
| 20-24 | 1,388,320 | 686,709 | 701,611 | 9.7 | 9.9 | 9.4 | 97.9 |
| 25-29 | 1,182,038 | 581,962 | 600,076 | 8.2 | 8.4 | 8.1 | 97 |
| 30-34 | 968,795 | 465,878 | 502,917 | 6.7 | 6.7 | 6.8 | 92.6 |
| 35-39 | 1,051,057 | 515,341 | 535,716 | 7.3 | 7.4 | 7.2 | 96.2 |
| 40-44 | 861,976 | 391,915 | 470,061 | 6 | 5.7 | 6.3 | 83.4 |
| 45-49 | 597,678 | 268,912 | 328,766 | 4.2 | 3.9 | 4.4 | 81.8 |
| 50-54 | 433,902 | 181,747 | 252,155 | 3 | 2.6 | 3.4 | 72.1 |
| 55-59 | 320,961 | 133,485 | 187,476 | 2.2 | 1.9 | 2.5 | 71.2 |
| 60-64 | 325,630 | 134,572 | 191,058 | 2.3 | 1.9 | 2.6 | 70.4 |
| 65-69 | 220,748 | 85,776 | 134,972 | 1.5 | 1.2 | 1.8 | 63.6 |
| 70-74 | 154,502 | 59,947 | 94,555 | 1.1 | 0.9 | 1.3 | 63.4 |
| 75-79 | 85,503 | 31,987 | 53,516 | 0.6 | 0.5 | 0.7 | 59.8 |
| 80-84 | 44,188 | 16,391 | 27,797 | 0.3 | 0.2 | 0.4 | 59 |
| 85-89 | 13,413 | 4,974 | 8,439 | 0.1 | 0.1 | 0.1 | 58.9 |
| 90-94 | 5,927 | 2,188 | 3,739 | 0 | 0 | 0.1 | 58.5 |
| 95-99 | 478 | 152 | 326 | 0 | 0 | 0 | 46.6 |
| 100+ | 99 | 30 | 69 | 0 | 0 | 0 | 43.5 |
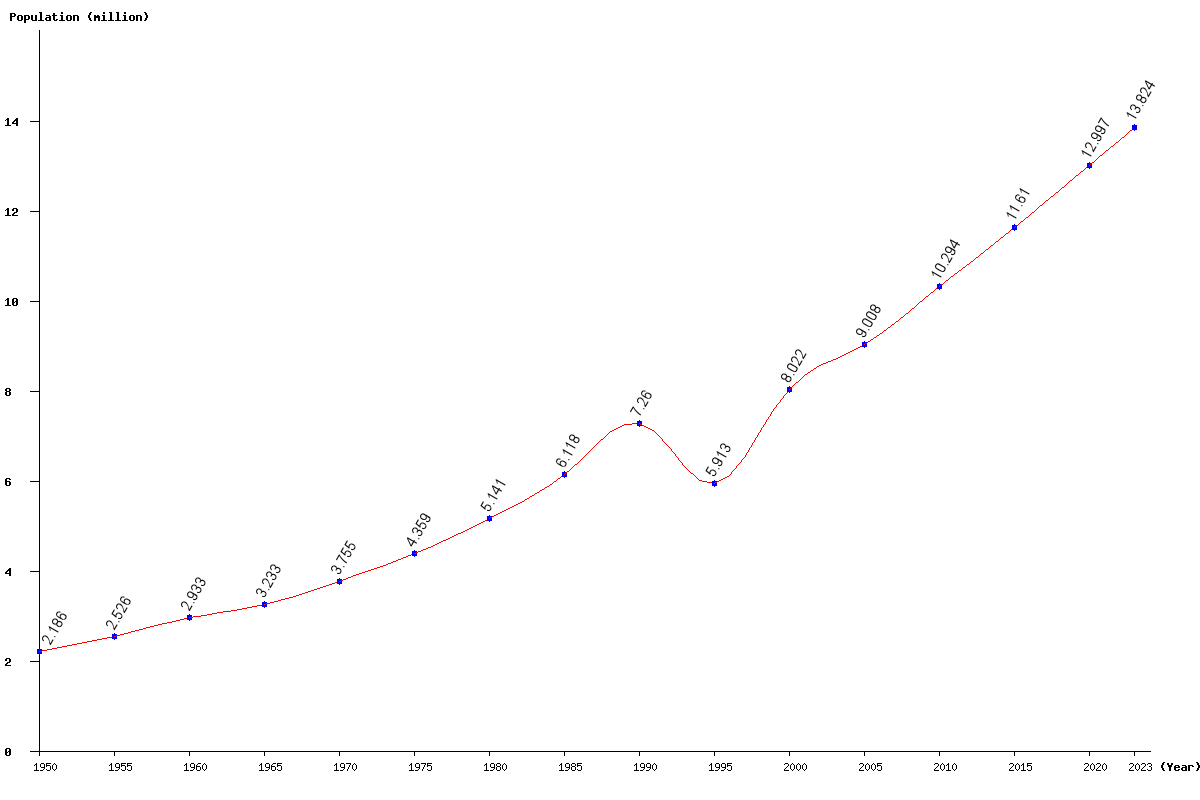
| Year | Population | Yearly % Change |
Yearly Change |
Sex ratio | Density (P/Km²) |
|---|---|---|---|---|---|
| 2025 | 14,377,389 | 1.97 | 277,256 | 93.13 | 582.79 |
| 2024 | 14,100,133 | 2.00 | 275,831 | 93.02 | 571.55 |
| 2023 | 13,824,302 | 2.03 | 275,213 | 92.90 | 560.37 |
| 2022 | 13,549,089 | 2.08 | 275,679 | 92.79 | 549.21 |
| 2021 | 13,273,410 | 2.13 | 276,816 | 92.67 | 538.04 |
| 2020 | 12,996,594 | 2.19 | 278,396 | 92.54 | 526.82 |
| 2019 | 12,718,198 | 2.25 | 279,475 | 92.42 | 515.53 |
| 2018 | 12,438,723 | 2.30 | 279,137 | 92.28 | 504.20 |
| 2017 | 12,159,586 | 2.33 | 276,820 | 92.15 | 492.89 |
| 2016 | 11,882,766 | 2.35 | 273,100 | 92.02 | 481.67 |
| 2015 | 11,609,666 | 2.36 | 268,122 | 91.89 | 470.60 |
| 2014 | 11,341,544 | 2.38 | 263,449 | 91.77 | 459.73 |
| 2013 | 11,078,095 | 2.41 | 260,745 | 91.66 | 449.05 |
| 2012 | 10,817,350 | 2.47 | 260,921 | 91.56 | 438.48 |
| 2011 | 10,556,429 | 2.55 | 262,760 | 91.46 | 427.91 |
| 2010 | 10,293,669 | 2.68 | 269,075 | 91.38 | 417.25 |
| 2005 | 9,008,230 | 12.30 | 986,355 | 91.20 | 365.15 |
| 2000 | 8,021,875 | 35.67 | 2,109,120 | 92.16 | 325.17 |
| 1995 | 5,912,755 | -18.55 | -1,346,985 | 92.37 | 239.67 |
| 1990 | 7,259,740 | 18.66 | 1,141,774 | 96.47 | 294.27 |
| 1985 | 6,117,966 | 19.01 | 977,180 | 96.91 | 247.99 |
| 1980 | 5,140,786 | 17.93 | 781,620 | 96.72 | 208.38 |
| 1975 | 4,359,166 | 16.10 | 604,620 | 96.50 | 176.70 |
| 1970 | 3,754,546 | 16.13 | 521,609 | 96.40 | 152.19 |
| 1965 | 3,232,937 | 10.21 | 299,513 | 96.25 | 131.05 |
| 1960 | 2,933,424 | 16.15 | 407,900 | 96.37 | 118.91 |
| 1955 | 2,525,524 | 15.52 | 339,337 | 96.43 | 102.37 |
| 1950 | 2,186,187 | 96.64 | 88.62 |