Romania population
20,979,322
Births this year: 1,925,423
Births today 88
Deaths this year 2,545,837
Deaths today 116
20,979,322
| Region Name | Percents | Number |
|---|---|---|
| Eastern Orthodox (including all sub-denominations) | 81.9% | 17,690,184 people |
| Protestant (various denominations including Reformed and Pentecostal) | 6.4% | 1,382,383 people |
| Roman Catholic | 4.3% | 928,789 people |
| other (includes Muslim) | 0.9% | 194,398 people |
| none or atheist | 0.2% | 43,199 people |
| unspecified | 6.3% | 1,360,783 people |
| Ethnic groups Name | Percents | Number |
|---|---|---|
| Romanian | 83.4% | 18,014,180 people |
| Hungarian | 6.1% | 1,317,584 people |
| Roma | 3.1% | 669,592 people |
| Ukrainian | 0.3% | 64,799 people |
| German | 0.2% | 43,199 people |
| other | 0.7% | 151,198 people |
| unspecified | 6.1% | 1,317,584 people |
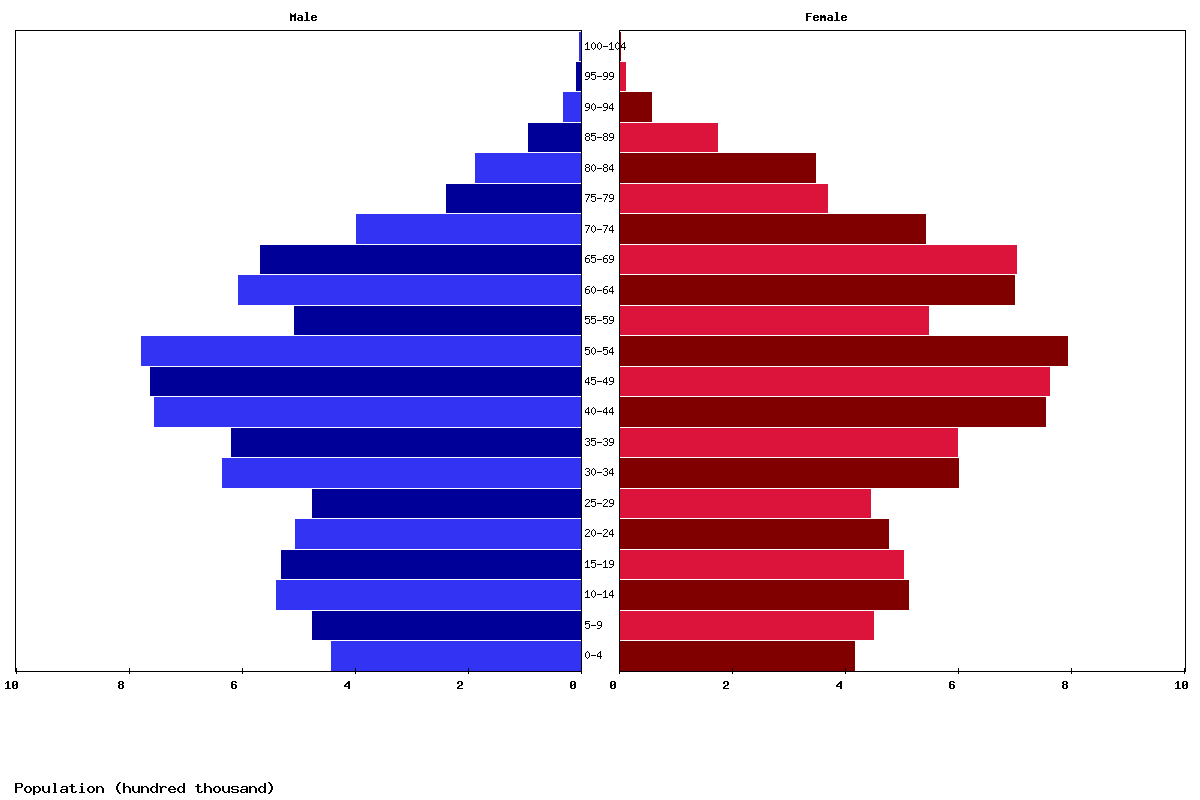
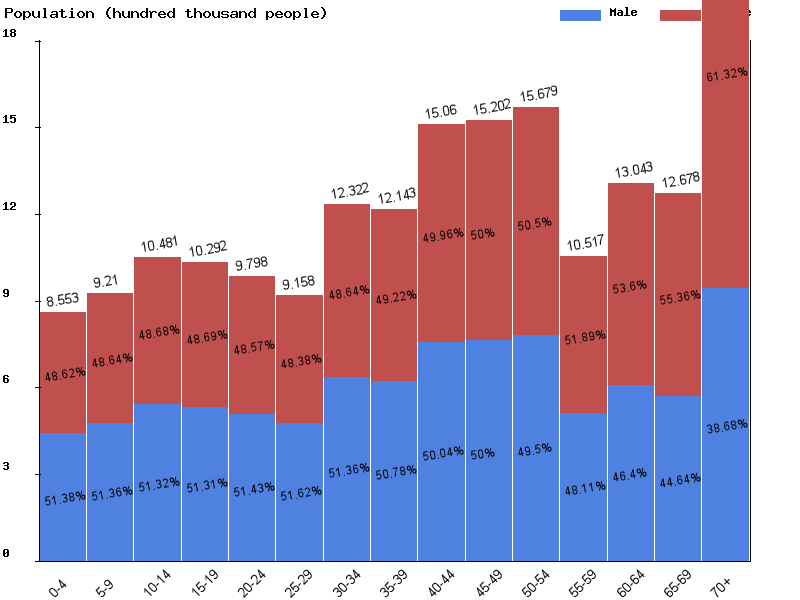
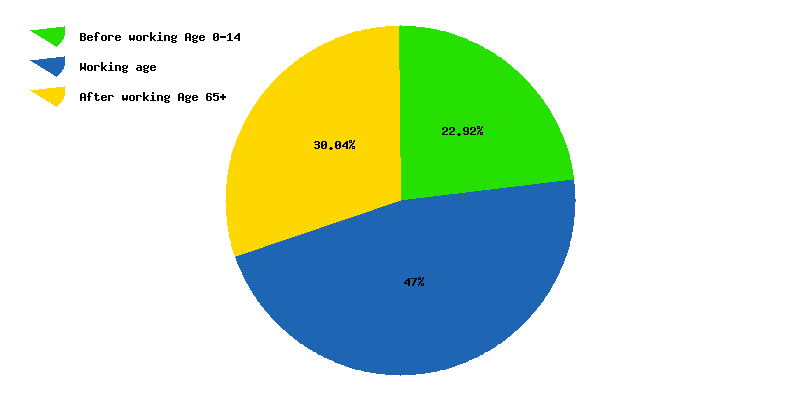
| Age | Both Sexes Population | Male Population | Female Population | Both Sexes (%) | Male (%) | Female (%) | Sex ratio (female/male) |
|---|---|---|---|---|---|---|---|
| Total | 18,229,006 | 8,802,458 | 9,426,548 | 100 | 100 | 100 | 93.4 |
| 00-04 | 794,883 | 408,435 | 386,448 | 4.4 | 4.6 | 4.1 | 105.7 |
| 05-09 | 853,114 | 438,236 | 414,878 | 4.7 | 5 | 4.4 | 105.6 |
| 10-14 | 919,697 | 472,337 | 447,360 | 5 | 5.4 | 4.7 | 105.6 |
| 15-19 | 1,035,075 | 531,218 | 503,857 | 5.7 | 6 | 5.3 | 105.4 |
| 20-24 | 990,873 | 508,573 | 482,300 | 5.4 | 5.8 | 5.1 | 105.4 |
| 25-29 | 941,483 | 483,836 | 457,647 | 5.2 | 5.5 | 4.9 | 105.7 |
| 30-34 | 895,485 | 460,569 | 434,916 | 4.9 | 5.2 | 4.6 | 105.9 |
| 35-39 | 1,220,459 | 624,807 | 595,652 | 6.7 | 7.1 | 6.3 | 104.9 |
| 40-44 | 1,204,638 | 609,763 | 594,875 | 6.6 | 6.9 | 6.3 | 102.5 |
| 45-49 | 1,481,944 | 736,589 | 745,355 | 8.1 | 8.4 | 7.9 | 98.8 |
| 50-54 | 1,475,958 | 728,043 | 747,915 | 8.1 | 8.3 | 7.9 | 97.3 |
| 55-59 | 1,502,235 | 728,875 | 773,360 | 8.2 | 8.3 | 8.2 | 94.2 |
| 60-64 | 992,868 | 465,779 | 527,089 | 5.4 | 5.3 | 5.6 | 88.4 |
| 65-69 | 1,199,958 | 536,959 | 662,999 | 6.6 | 6.1 | 7 | 81 |
| 70-74 | 1,115,633 | 473,452 | 642,181 | 6.1 | 5.4 | 6.8 | 73.7 |
| 75-79 | 765,933 | 303,923 | 462,010 | 4.2 | 3.5 | 4.9 | 65.8 |
| 80-84 | 427,397 | 155,653 | 271,744 | 2.3 | 1.8 | 2.9 | 57.3 |
| 85-89 | 291,224 | 94,536 | 196,688 | 1.6 | 1.1 | 2.1 | 48.1 |
| 90-94 | 98,520 | 33,032 | 65,488 | 0.5 | 0.4 | 0.7 | 50.4 |
| 95-99 | 19,617 | 7,034 | 12,583 | 0.1 | 0.1 | 0.1 | 55.9 |
| 100+ | 2,012 | 809 | 1,203 | 0 | 0 | 0 | 67.2 |
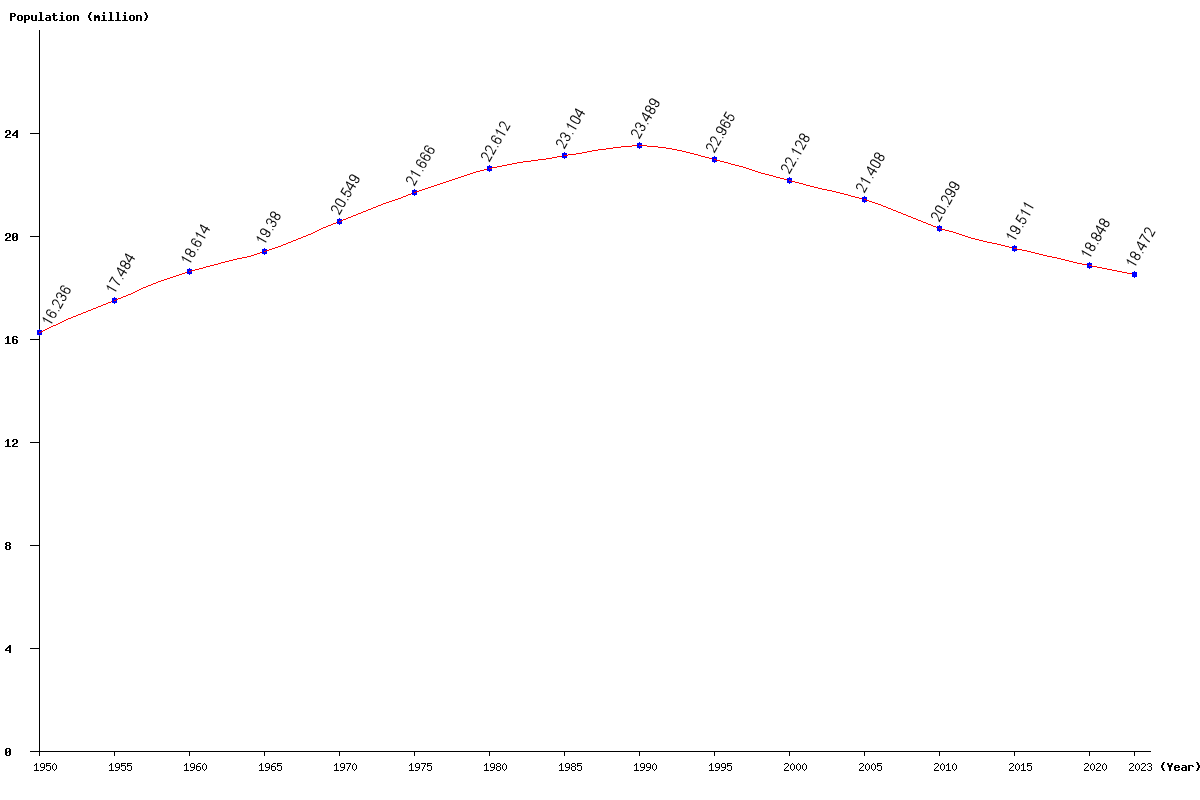
| Year | Population | Yearly % Change |
Yearly Change |
Sex ratio | Density (P/Km²) |
|---|---|---|---|---|---|
| 2025 | 18,229,006 | -0.66 | -120,857 | 93.38 | 79.20 |
| 2024 | 18,349,863 | -0.66 | -122,493 | 93.42 | 79.72 |
| 2023 | 18,472,356 | -0.67 | -123,952 | 93.47 | 80.26 |
| 2022 | 18,596,308 | -0.67 | -125,083 | 93.52 | 80.79 |
| 2021 | 18,721,391 | -0.67 | -126,114 | 93.57 | 81.34 |
| 2020 | 18,847,505 | -0.67 | -127,676 | 93.62 | 81.89 |
| 2019 | 18,975,181 | -0.68 | -129,908 | 93.67 | 82.44 |
| 2018 | 19,105,089 | -0.69 | -132,424 | 93.73 | 83.00 |
| 2017 | 19,237,513 | -0.70 | -135,221 | 93.79 | 83.58 |
| 2016 | 19,372,734 | -0.71 | -138,590 | 93.86 | 84.17 |
| 2015 | 19,511,324 | -0.71 | -140,230 | 93.94 | 84.77 |
| 2014 | 19,651,554 | -0.72 | -142,609 | 94.03 | 85.38 |
| 2013 | 19,794,163 | -0.76 | -150,791 | 94.12 | 86.00 |
| 2012 | 19,944,954 | -0.83 | -166,710 | 94.22 | 86.65 |
| 2011 | 20,111,664 | -0.92 | -187,174 | 94.34 | 87.38 |
| 2010 | 20,298,838 | -1.03 | -211,425 | 94.46 | 88.19 |
| 2005 | 21,407,619 | -3.26 | -720,520 | 95.17 | 93.01 |
| 2000 | 22,128,139 | -3.64 | -836,986 | 95.77 | 96.14 |
| 1995 | 22,965,125 | -2.23 | -524,236 | 96.61 | 99.77 |
| 1990 | 23,489,361 | 1.67 | 385,724 | 97.23 | 102.05 |
| 1985 | 23,103,637 | 2.17 | 491,488 | 97.31 | 100.38 |
| 1980 | 22,612,149 | 4.37 | 946,369 | 97.32 | 98.24 |
| 1975 | 21,665,780 | 5.43 | 1,116,764 | 97.01 | 94.13 |
| 1970 | 20,549,016 | 6.03 | 1,169,462 | 96.54 | 89.28 |
| 1965 | 19,379,554 | 4.11 | 765,719 | 96.01 | 84.20 |
| 1960 | 18,613,835 | 6.46 | 1,129,924 | 95.44 | 80.87 |
| 1955 | 17,483,911 | 7.68 | 1,247,619 | 94.60 | 75.96 |
| 1950 | 16,236,292 | 93.58 | 70.54 |