Nicaragua population
5,907,640
Births this year: 0
Births today 0
Deaths this year 59,158
Deaths today 6
5,907,640
| Region Name | Percents | Number |
|---|---|---|
| Roman Catholic 58.5, Protestant (Evangelical, Moravian) 23.2, other 18.3 | 58523218.3% | 3,491,962,219,060 people |
| Ethnic groups Name | Percents | Number |
|---|---|---|
| mestizo (mixed Amerindian and white) | 69% | 4,117,091 people |
| white | 17% | 1,014,356 people |
| black | 9% | 537,012 people |
| Amerindian | 5% | 298,340 people |
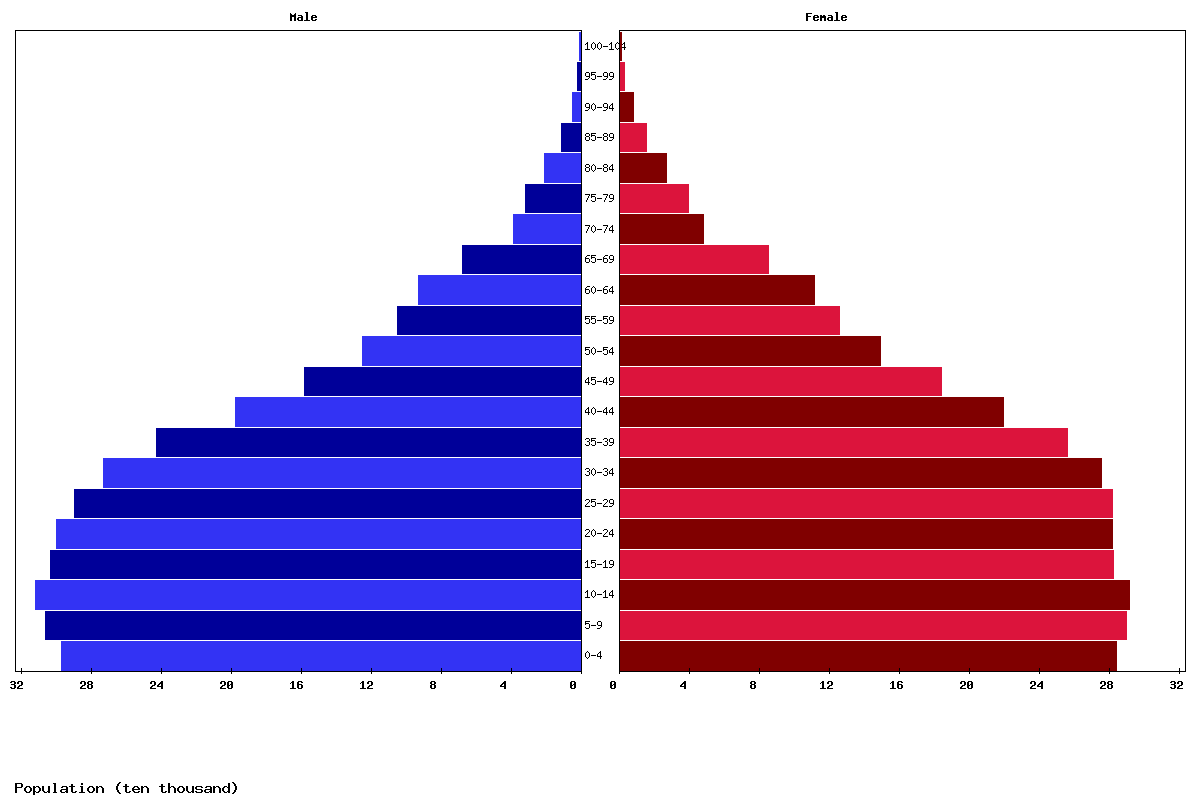
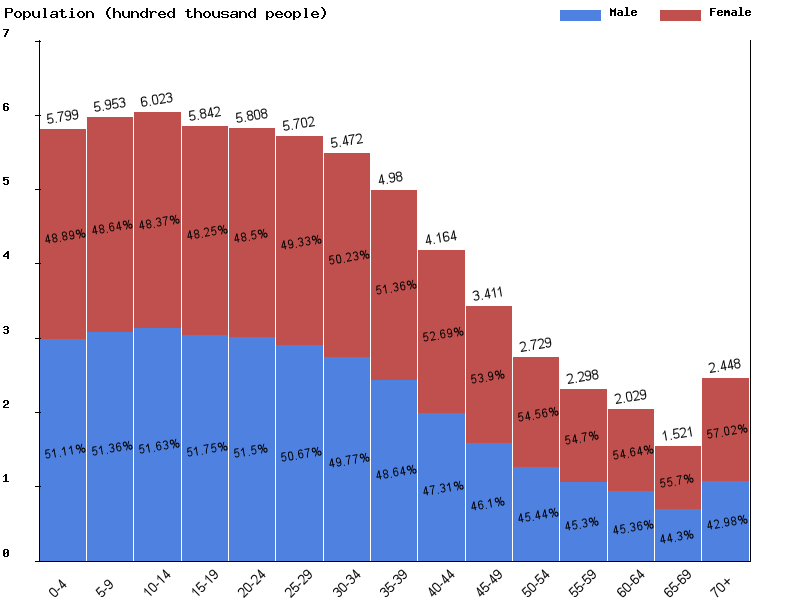
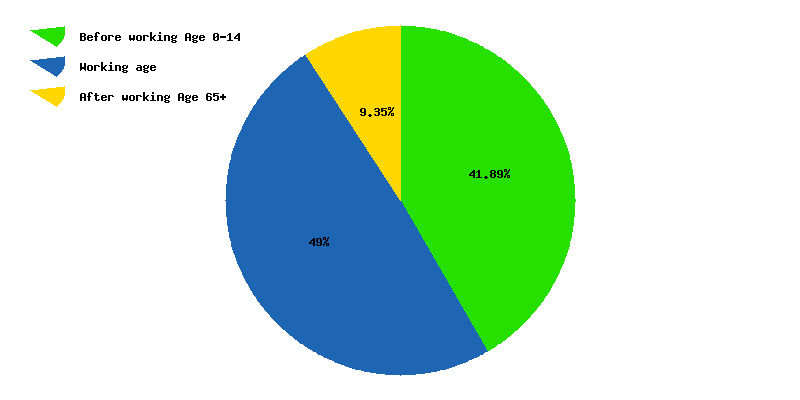
| Age | Both Sexes Population | Male Population | Female Population | Both Sexes (%) | Male (%) | Female (%) | Sex ratio (female/male) |
|---|---|---|---|---|---|---|---|
| Total | 6,736,108 | 3,323,442 | 3,412,666 | 100 | 100 | 100 | 97.4 |
| 00-04 | 549,605 | 281,059 | 268,546 | 8.2 | 8.5 | 7.9 | 104.7 |
| 05-09 | 572,155 | 293,567 | 278,588 | 8.5 | 8.8 | 8.2 | 105.4 |
| 10-14 | 583,937 | 301,014 | 282,923 | 8.7 | 9.1 | 8.3 | 106.4 |
| 15-19 | 587,219 | 303,933 | 283,286 | 8.7 | 9.1 | 8.3 | 107.3 |
| 20-24 | 566,708 | 292,864 | 273,844 | 8.4 | 8.8 | 8 | 106.9 |
| 25-29 | 564,438 | 289,227 | 275,211 | 8.4 | 8.7 | 8.1 | 105.1 |
| 30-34 | 556,474 | 280,123 | 276,351 | 8.3 | 8.4 | 8.1 | 101.4 |
| 35-39 | 535,530 | 264,647 | 270,883 | 8 | 8 | 7.9 | 97.7 |
| 40-44 | 487,375 | 235,469 | 251,906 | 7.2 | 7.1 | 7.4 | 93.5 |
| 45-49 | 406,757 | 190,866 | 215,891 | 6 | 5.7 | 6.3 | 88.4 |
| 50-54 | 332,131 | 151,719 | 180,412 | 4.9 | 4.6 | 5.3 | 84.1 |
| 55-59 | 264,099 | 118,875 | 145,224 | 3.9 | 3.6 | 4.3 | 81.9 |
| 60-64 | 219,700 | 98,672 | 121,028 | 3.3 | 3 | 3.5 | 81.5 |
| 65-69 | 189,963 | 85,281 | 104,682 | 2.8 | 2.6 | 3.1 | 81.5 |
| 70-74 | 138,070 | 60,271 | 77,799 | 2 | 1.8 | 2.3 | 77.5 |
| 75-79 | 74,176 | 32,096 | 42,080 | 1.1 | 1 | 1.2 | 76.3 |
| 80-84 | 55,297 | 23,527 | 31,770 | 0.8 | 0.7 | 0.9 | 74.1 |
| 85-89 | 31,558 | 12,892 | 18,666 | 0.5 | 0.4 | 0.5 | 69.1 |
| 90-94 | 14,485 | 5,393 | 9,092 | 0.2 | 0.2 | 0.3 | 59.3 |
| 95-99 | 5,106 | 1,600 | 3,506 | 0.1 | 0 | 0.1 | 45.6 |
| 100+ | 1,325 | 347 | 978 | 0 | 0 | 0 | 35.5 |
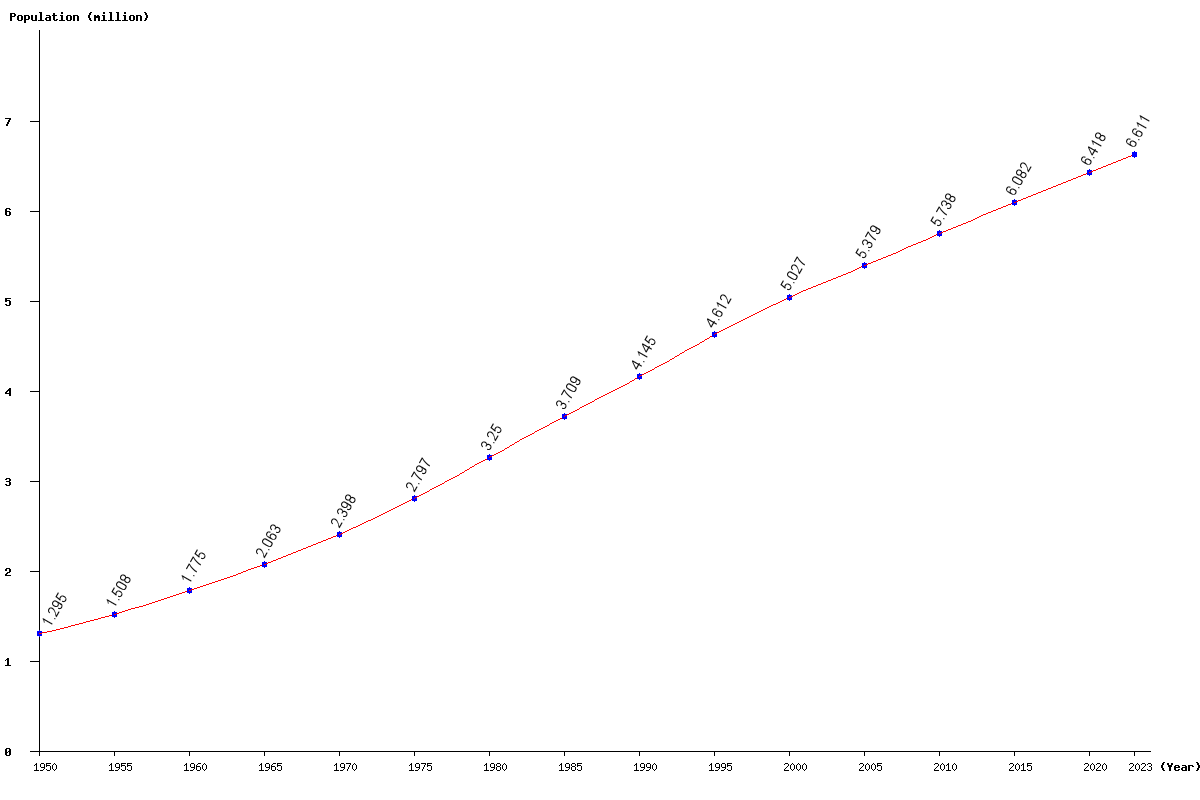
| Year | Population | Yearly % Change |
Yearly Change |
Sex ratio | Density (P/Km²) |
|---|---|---|---|---|---|
| 2025 | 6,736,108 | 0.93 | 62,036 | 97.39 | 55.98 |
| 2024 | 6,674,072 | 0.95 | 62,824 | 97.37 | 55.46 |
| 2023 | 6,611,248 | 0.97 | 63,614 | 97.35 | 54.94 |
| 2022 | 6,547,634 | 0.99 | 64,421 | 97.33 | 54.41 |
| 2021 | 6,483,213 | 1.02 | 65,223 | 97.31 | 53.87 |
| 2020 | 6,417,990 | 1.04 | 66,034 | 97.30 | 53.33 |
| 2019 | 6,351,956 | 1.06 | 66,784 | 97.28 | 52.78 |
| 2018 | 6,285,172 | 1.08 | 67,376 | 97.27 | 52.23 |
| 2017 | 6,217,796 | 1.10 | 67,761 | 97.25 | 51.67 |
| 2016 | 6,150,035 | 1.12 | 68,003 | 97.23 | 51.11 |
| 2015 | 6,082,032 | 1.13 | 68,119 | 97.21 | 50.54 |
| 2014 | 6,013,913 | 1.15 | 68,267 | 97.18 | 49.97 |
| 2013 | 5,945,646 | 1.17 | 68,612 | 97.15 | 49.41 |
| 2012 | 5,877,034 | 1.19 | 69,247 | 97.12 | 48.84 |
| 2011 | 5,807,787 | 1.22 | 70,065 | 97.10 | 48.26 |
| 2010 | 5,737,722 | 1.26 | 71,127 | 97.11 | 47.68 |
| 2005 | 5,379,327 | 7.01 | 352,535 | 97.48 | 44.70 |
| 2000 | 5,026,792 | 8.99 | 414,563 | 97.93 | 41.77 |
| 1995 | 4,612,229 | 11.28 | 467,665 | 98.14 | 38.33 |
| 1990 | 4,144,564 | 11.74 | 435,473 | 98.38 | 34.44 |
| 1985 | 3,709,091 | 14.13 | 459,181 | 99.39 | 30.82 |
| 1980 | 3,249,910 | 16.20 | 453,162 | 100.22 | 27.01 |
| 1975 | 2,796,748 | 16.62 | 398,653 | 100.48 | 23.24 |
| 1970 | 2,398,095 | 16.26 | 335,462 | 100.03 | 19.93 |
| 1965 | 2,062,633 | 16.22 | 287,937 | 99.95 | 17.14 |
| 1960 | 1,774,696 | 17.68 | 266,676 | 99.64 | 14.75 |
| 1955 | 1,508,020 | 16.45 | 213,027 | 99.16 | 12.53 |
| 1950 | 1,294,993 | 98.90 | 10.76 |