Namibia population
243,646
Births this year: 0
Births today 0
Deaths this year 0
Deaths today 0
243,646
| Region Name | Percents | Number |
|---|---|---|
| Christian | 85% | 207,099 people |
| indigenous beliefs | 15% | 36,547 people |
| Ethnic groups Name | Percents | Number |
|---|---|---|
| black | 87.5% | 213,190 people |
| white | 6% | 14,619 people |
| mixed | 6.5% | 15,837 people |
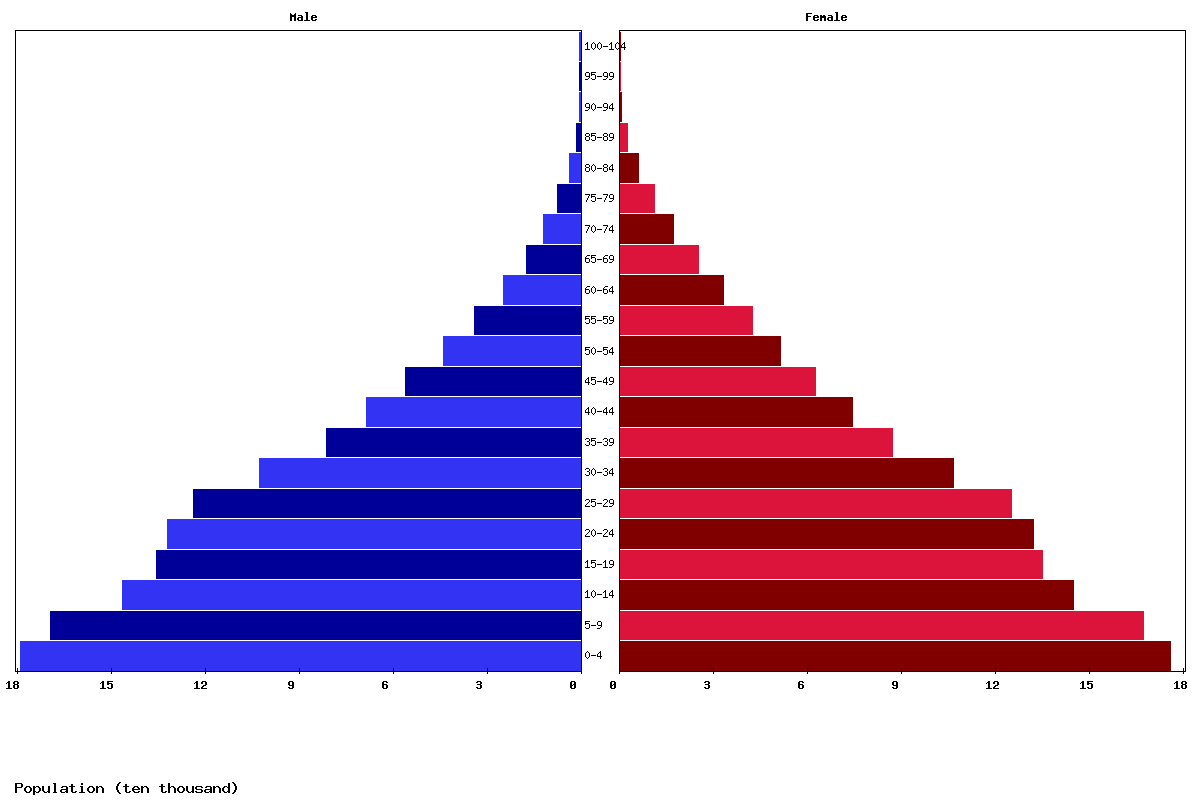
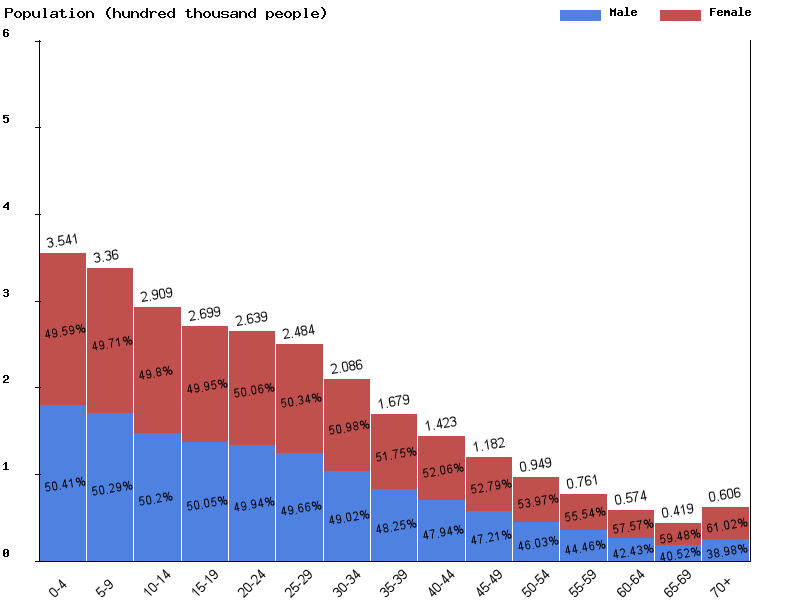
| Age | Both Sexes Population | Male Population | Female Population | Both Sexes (%) | Male (%) | Female (%) | Sex ratio (female/male) |
|---|---|---|---|---|---|---|---|
| Total | 3,002,495 | 1,470,014 | 1,532,481 | 100 | 100 | 100 | 95.9 |
| 00-04 | 361,316 | 182,279 | 179,037 | 12 | 12.4 | 11.7 | 101.8 |
| 05-09 | 352,297 | 177,377 | 174,920 | 11.7 | 12.1 | 11.4 | 101.4 |
| 10-14 | 334,904 | 168,316 | 166,588 | 11.2 | 11.4 | 10.9 | 101 |
| 15-19 | 289,258 | 145,045 | 144,213 | 9.6 | 9.9 | 9.4 | 100.6 |
| 20-24 | 267,721 | 133,745 | 133,976 | 8.9 | 9.1 | 8.7 | 99.8 |
| 25-29 | 260,480 | 129,922 | 130,558 | 8.7 | 8.8 | 8.5 | 99.5 |
| 30-34 | 243,646 | 120,975 | 122,671 | 8.1 | 8.2 | 8 | 98.6 |
| 35-39 | 202,465 | 99,226 | 103,239 | 6.7 | 6.8 | 6.7 | 96.1 |
| 40-44 | 161,183 | 77,635 | 83,548 | 5.4 | 5.3 | 5.5 | 92.9 |
| 45-49 | 135,380 | 64,568 | 70,812 | 4.5 | 4.4 | 4.6 | 91.2 |
| 50-54 | 111,448 | 52,092 | 59,356 | 3.7 | 3.5 | 3.9 | 87.8 |
| 55-59 | 88,779 | 40,218 | 48,561 | 3 | 2.7 | 3.2 | 82.8 |
| 60-64 | 69,884 | 30,331 | 39,553 | 2.3 | 2.1 | 2.6 | 76.7 |
| 65-69 | 50,918 | 20,883 | 30,035 | 1.7 | 1.4 | 2 | 69.5 |
| 70-74 | 34,925 | 13,504 | 21,421 | 1.2 | 0.9 | 1.4 | 63 |
| 75-79 | 21,427 | 8,163 | 13,264 | 0.7 | 0.6 | 0.9 | 61.5 |
| 80-84 | 11,146 | 4,019 | 7,127 | 0.4 | 0.3 | 0.5 | 56.4 |
| 85-89 | 4,128 | 1,373 | 2,755 | 0.1 | 0.1 | 0.2 | 49.8 |
| 90-94 | 1,031 | 304 | 727 | 0 | 0 | 0 | 41.8 |
| 95-99 | 149 | 37 | 112 | 0 | 0 | 0 | 33 |
| 100+ | 10 | 2 | 8 | 0 | 0 | 0 | 25 |
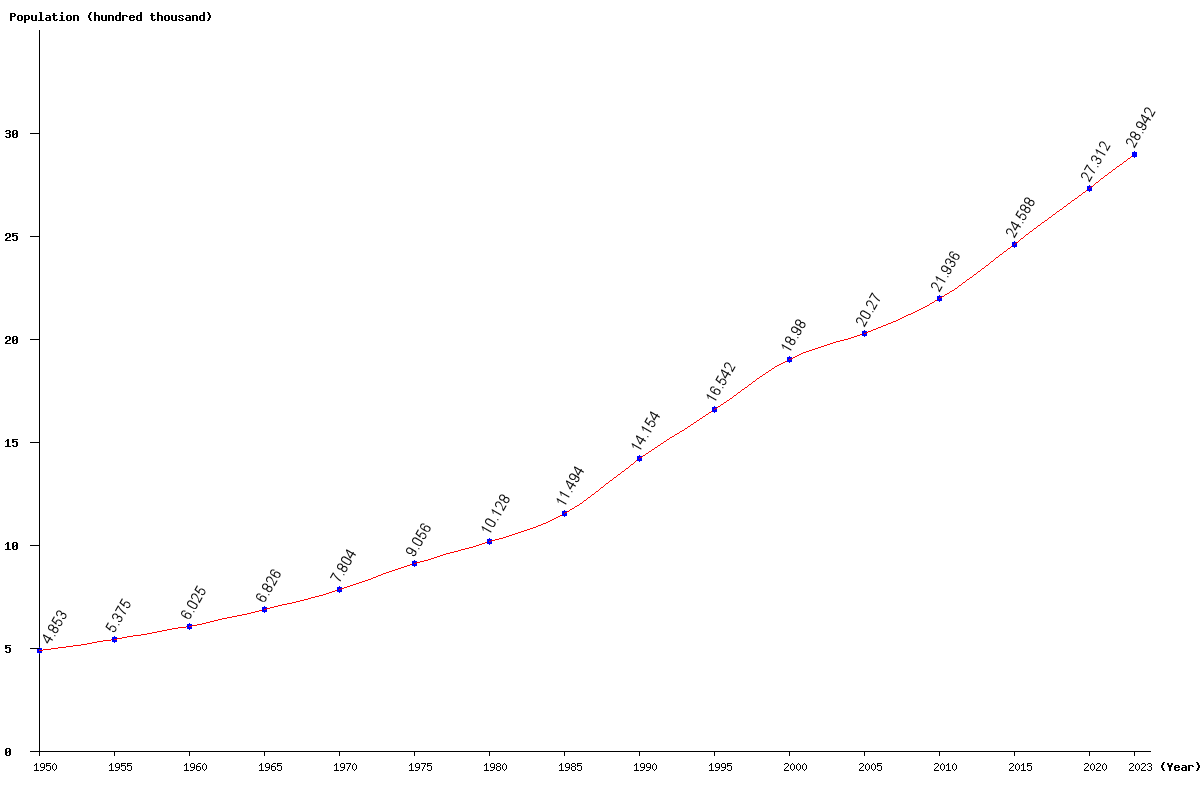
| Year | Population | Yearly % Change |
Yearly Change |
Sex ratio | Density (P/Km²) |
|---|---|---|---|---|---|
| 2025 | 3,002,495 | 1.84 | 54,141 | 95.92 | 3.65 |
| 2024 | 2,948,354 | 1.87 | 54,172 | 95.82 | 3.58 |
| 2023 | 2,894,182 | 1.91 | 54,231 | 95.72 | 3.52 |
| 2022 | 2,839,951 | 1.95 | 54,333 | 95.62 | 3.45 |
| 2021 | 2,785,618 | 1.99 | 54,453 | 95.52 | 3.38 |
| 2020 | 2,731,165 | 2.03 | 54,334 | 95.41 | 3.32 |
| 2019 | 2,676,831 | 2.06 | 54,108 | 95.30 | 3.25 |
| 2018 | 2,622,723 | 2.11 | 54,154 | 95.19 | 3.19 |
| 2017 | 2,568,569 | 2.17 | 54,588 | 95.08 | 3.12 |
| 2016 | 2,513,981 | 2.24 | 55,151 | 94.96 | 3.05 |
| 2015 | 2,458,830 | 2.33 | 55,972 | 94.83 | 2.99 |
| 2014 | 2,402,858 | 2.40 | 56,266 | 94.68 | 2.92 |
| 2013 | 2,346,592 | 2.40 | 54,947 | 94.51 | 2.85 |
| 2012 | 2,291,645 | 2.30 | 51,484 | 94.35 | 2.78 |
| 2011 | 2,240,161 | 2.12 | 46,518 | 94.26 | 2.72 |
| 2010 | 2,193,643 | 1.92 | 41,286 | 94.25 | 2.66 |
| 2005 | 2,027,026 | 6.80 | 129,073 | 95.39 | 2.46 |
| 2000 | 1,897,953 | 14.73 | 243,739 | 96.65 | 2.31 |
| 1995 | 1,654,214 | 16.87 | 238,767 | 96.17 | 2.01 |
| 1990 | 1,415,447 | 23.15 | 266,058 | 95.58 | 1.72 |
| 1985 | 1,149,389 | 13.49 | 136,628 | 94.65 | 1.40 |
| 1980 | 1,012,761 | 11.83 | 107,114 | 95.61 | 1.23 |
| 1975 | 905,647 | 16.05 | 125,261 | 97.71 | 1.10 |
| 1970 | 780,386 | 14.33 | 97,833 | 97.60 | 0.95 |
| 1965 | 682,553 | 13.28 | 80,008 | 97.48 | 0.83 |
| 1960 | 602,545 | 12.10 | 65,026 | 97.50 | 0.73 |
| 1955 | 537,519 | 10.77 | 52,245 | 97.80 | 0.65 |
| 1950 | 485,274 | 98.65 | 0.59 |