Mozambique population
2,529,392
Births this year: 0
Births today 0
Deaths this year 63,623
Deaths today 7
2,529,392
| Region Name | Percents | Number |
|---|---|---|
| Roman Catholic | 28.4% | 736,416 people |
| Muslim | 17.9% | 464,150 people |
| Zionist Christian | 15.5% | 401,917 people |
| Protestant (includes Pentecostal and Anglican) | 12.2% | 316,348 people |
| other | 6.7% | 173,732 people |
| none | 18.7% | 484,894 people |
| unspecified | 0.7% | 18,151 people |
| Ethnic groups Name | Percents | Number |
|---|---|---|
| African (Makhuwa, Tsonga, Lomwe, Sena, and others) | 99.66% | 2,584,199 people |
| Europeans | 0.06% | 1,556 people |
| Euro-Africans | 0.2% | 5,186 people |
| Indians | 0.08% | 2,074 people |
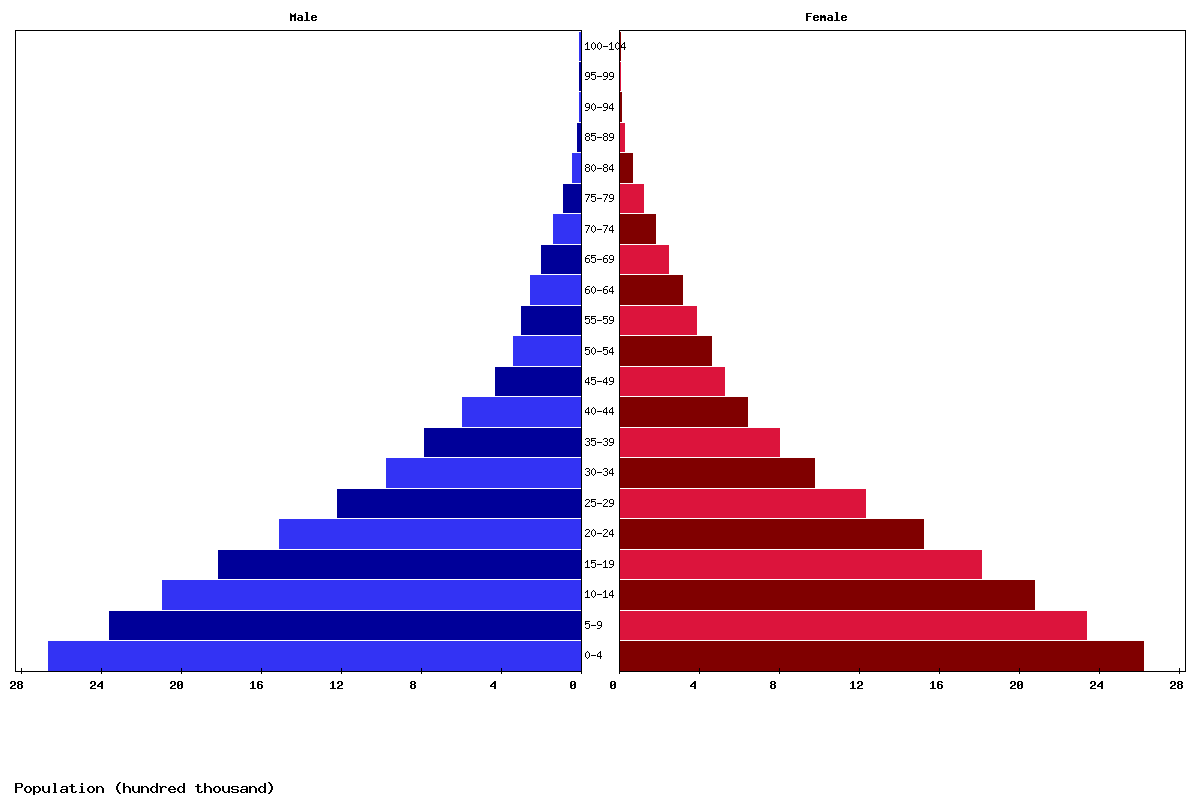
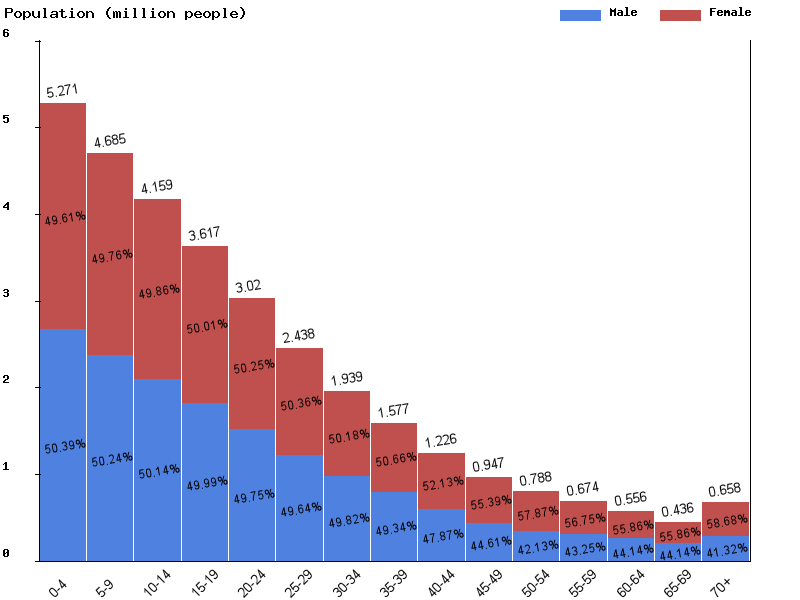
| Age | Both Sexes Population | Male Population | Female Population | Both Sexes (%) | Male (%) | Female (%) | Sex ratio (female/male) |
|---|---|---|---|---|---|---|---|
| Total | 36,461,507 | 17,966,796 | 18,494,711 | 100 | 100 | 100 | 97.1 |
| 00-04 | 5,801,261 | 2,923,725 | 2,877,536 | 15.9 | 16.3 | 15.6 | 101.6 |
| 05-09 | 5,152,378 | 2,589,292 | 2,563,086 | 14.1 | 14.4 | 13.9 | 101 |
| 10-14 | 4,643,207 | 2,330,185 | 2,313,022 | 12.7 | 13 | 12.5 | 100.7 |
| 15-19 | 4,120,801 | 2,063,293 | 2,057,508 | 11.3 | 11.5 | 11.1 | 100.3 |
| 20-24 | 3,559,395 | 1,773,765 | 1,785,630 | 9.8 | 9.9 | 9.7 | 99.3 |
| 25-29 | 2,933,982 | 1,458,212 | 1,475,770 | 8 | 8.1 | 8 | 98.8 |
| 30-34 | 2,325,924 | 1,158,462 | 1,167,462 | 6.4 | 6.4 | 6.3 | 99.2 |
| 35-39 | 1,811,026 | 905,963 | 905,063 | 5 | 5 | 4.9 | 100.1 |
| 40-44 | 1,457,078 | 719,217 | 737,861 | 4 | 4 | 4 | 97.5 |
| 45-49 | 1,142,255 | 543,871 | 598,384 | 3.1 | 3 | 3.2 | 90.9 |
| 50-54 | 887,900 | 392,332 | 495,568 | 2.4 | 2.2 | 2.7 | 79.2 |
| 55-59 | 739,576 | 307,996 | 431,580 | 2 | 1.7 | 2.3 | 71.4 |
| 60-64 | 621,779 | 265,110 | 356,669 | 1.7 | 1.5 | 1.9 | 74.3 |
| 65-69 | 492,463 | 213,431 | 279,032 | 1.4 | 1.2 | 1.5 | 76.5 |
| 70-74 | 360,844 | 155,866 | 204,978 | 1 | 0.9 | 1.1 | 76 |
| 75-79 | 231,435 | 96,359 | 135,076 | 0.6 | 0.5 | 0.7 | 71.3 |
| 80-84 | 121,468 | 48,304 | 73,164 | 0.3 | 0.3 | 0.4 | 66 |
| 85-89 | 45,817 | 17,103 | 28,714 | 0.1 | 0.1 | 0.2 | 59.6 |
| 90-94 | 11,255 | 3,833 | 7,422 | 0 | 0 | 0 | 51.6 |
| 95-99 | 1,548 | 451 | 1,097 | 0 | 0 | 0 | 41.1 |
| 100+ | 115 | 26 | 89 | 0 | 0 | 0 | 29.2 |
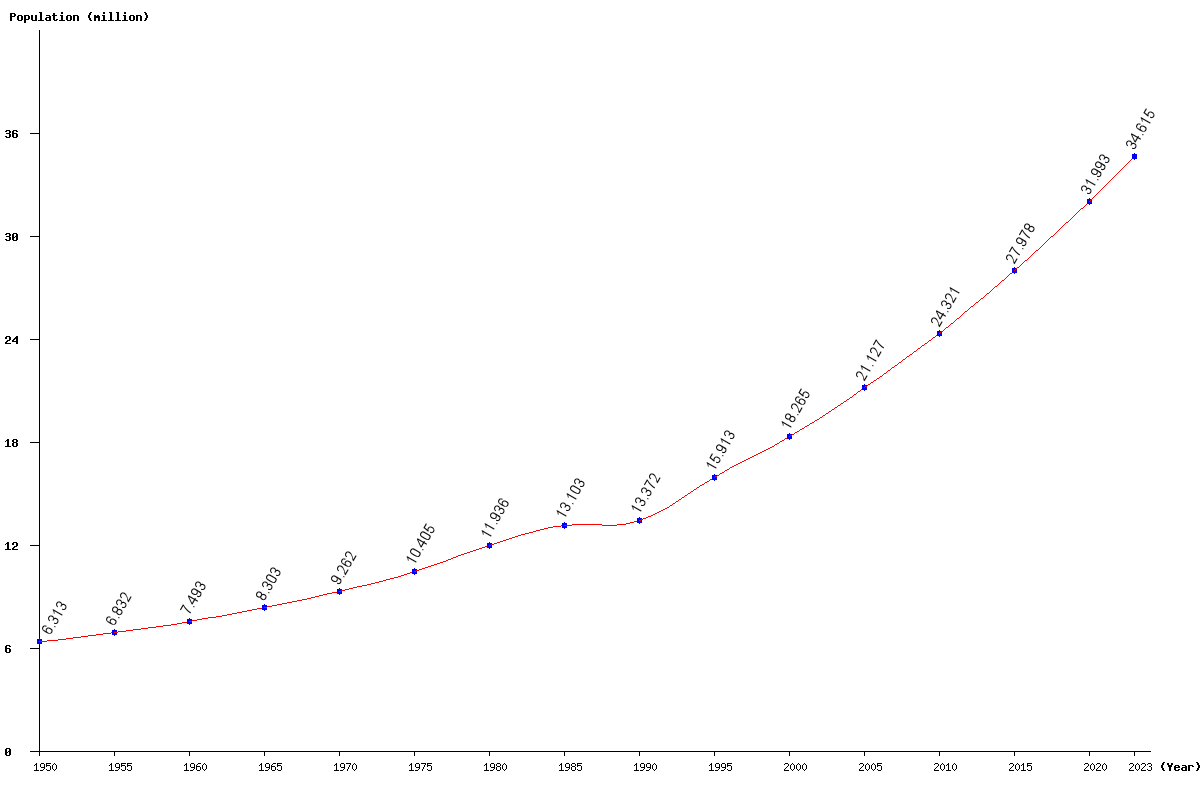
| Year | Population | Yearly % Change |
Yearly Change |
Sex ratio | Density (P/Km²) |
|---|---|---|---|---|---|
| 2025 | 36,461,507 | 2.63 | 933,511 | 97.15 | 46.37 |
| 2024 | 35,527,996 | 2.64 | 913,086 | 97.01 | 45.18 |
| 2023 | 34,614,910 | 2.65 | 893,110 | 96.87 | 44.02 |
| 2022 | 33,721,800 | 2.66 | 873,759 | 96.73 | 42.88 |
| 2021 | 32,848,041 | 2.67 | 855,044 | 96.57 | 41.77 |
| 2020 | 31,992,997 | 2.68 | 836,220 | 96.41 | 40.68 |
| 2019 | 31,156,777 | 2.70 | 817,789 | 96.23 | 39.62 |
| 2018 | 30,338,988 | 2.71 | 801,074 | 96.05 | 38.58 |
| 2017 | 29,537,914 | 2.74 | 786,552 | 95.87 | 37.56 |
| 2016 | 28,751,362 | 2.76 | 773,499 | 95.68 | 36.56 |
| 2015 | 27,977,863 | 2.80 | 761,587 | 95.49 | 35.58 |
| 2014 | 27,216,276 | 2.83 | 749,096 | 95.30 | 34.61 |
| 2013 | 26,467,180 | 2.85 | 734,252 | 95.12 | 33.66 |
| 2012 | 25,732,928 | 2.86 | 716,007 | 94.94 | 32.72 |
| 2011 | 25,016,921 | 2.86 | 695,464 | 94.75 | 31.81 |
| 2010 | 24,321,457 | 2.85 | 673,642 | 94.57 | 30.93 |
| 2005 | 21,126,676 | 15.67 | 2,862,140 | 93.58 | 26.87 |
| 2000 | 18,264,536 | 14.78 | 2,351,435 | 92.29 | 23.23 |
| 1995 | 15,913,101 | 19.00 | 2,541,130 | 91.34 | 20.24 |
| 1990 | 13,371,971 | 2.05 | 268,989 | 91.52 | 17.00 |
| 1985 | 13,102,982 | 9.77 | 1,166,603 | 95.10 | 16.66 |
| 1980 | 11,936,379 | 14.72 | 1,531,379 | 95.70 | 15.18 |
| 1975 | 10,405,000 | 12.34 | 1,142,922 | 95.81 | 13.23 |
| 1970 | 9,262,078 | 11.55 | 959,342 | 95.67 | 11.78 |
| 1965 | 8,302,736 | 10.80 | 809,458 | 95.59 | 10.56 |
| 1960 | 7,493,278 | 9.68 | 661,163 | 95.53 | 9.53 |
| 1955 | 6,832,115 | 8.22 | 518,825 | 95.53 | 8.69 |
| 1950 | 6,313,290 | 95.60 | 8.03 |