Montserrat population
550
Births this year: 56
Births today 0
Deaths this year 32
Deaths today 0
550
| Region Name | Percents | Number |
|---|---|---|
| Protestant (includes Anglican, Methodist, Pentecostal, Seventh Day Adventist, and Church of God) | 67.1% | 353 people |
| Roman Catholic | 11.6% | 61 people |
| Rastafarian | 1.4% | 7 people |
| other | 6.5% | 34 people |
| none | 2.6% | 14 people |
| unspecified | 10.8% | 57 people |
| Ethnic groups Name | Percents | Number |
|---|---|---|
| African/black | 88.4% | 465 people |
| mixed | 3.7% | 19 people |
| hispanic/Spanish | 3% | 16 people |
| caucasian/white | 2.7% | 14 people |
| East Indian/Indian | 1.5% | 8 people |
| other | 0.7% | 4 people |
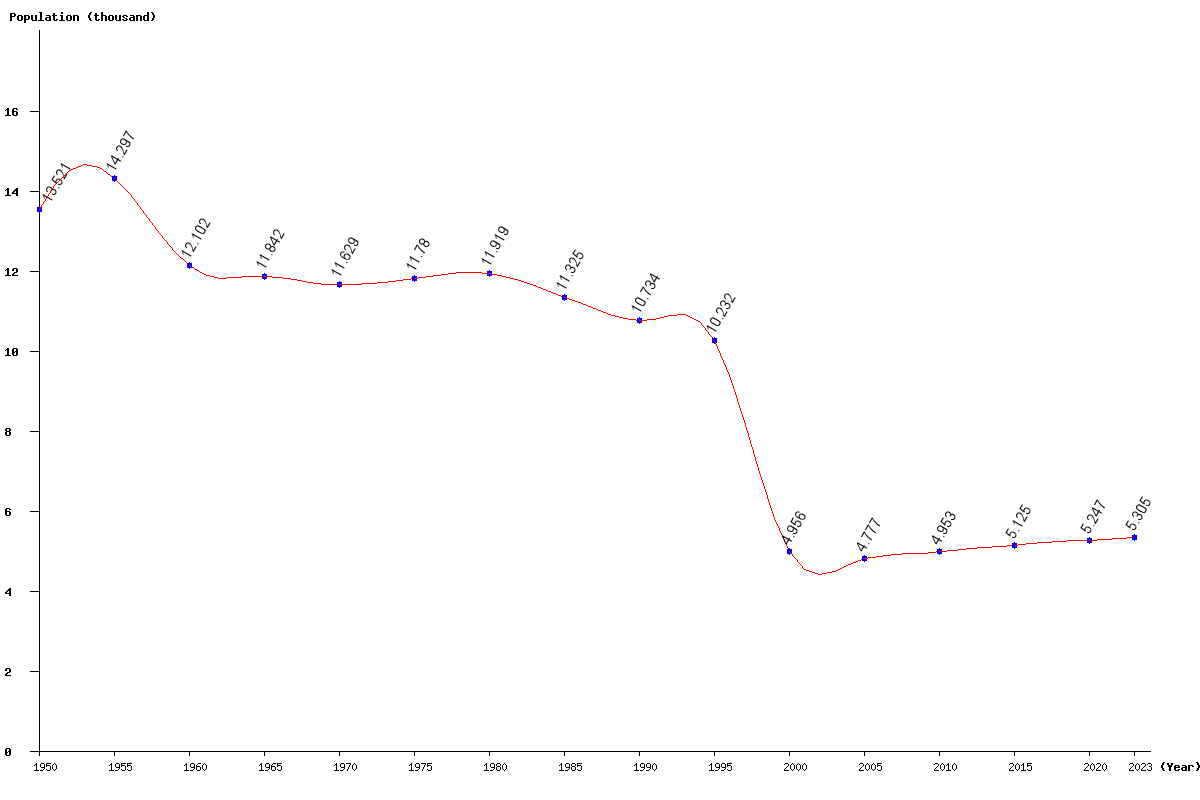
| Year | Population | Yearly % Change |
Yearly Change |
Sex ratio | Density (P/Km²) |
|---|---|---|---|---|---|
| 2025 | 5,340 | 0.32 | 17 | 98.17 | 53.40 |
| 2024 | 5,323 | 0.34 | 18 | 98.21 | 53.23 |
| 2023 | 5,305 | 0.34 | 18 | 98.25 | 53.05 |
| 2022 | 5,287 | 0.38 | 20 | 98.28 | 52.87 |
| 2021 | 5,267 | 0.38 | 20 | 98.29 | 52.67 |
| 2020 | 5,247 | 0.40 | 21 | 98.27 | 52.47 |
| 2019 | 5,226 | 0.44 | 23 | 98.21 | 52.26 |
| 2018 | 5,203 | 0.46 | 24 | 98.12 | 52.03 |
| 2017 | 5,179 | 0.49 | 25 | 98.00 | 51.79 |
| 2016 | 5,154 | 0.57 | 29 | 97.86 | 51.54 |
| 2015 | 5,125 | 0.61 | 31 | 97.71 | 51.25 |
| 2014 | 5,094 | 0.61 | 31 | 97.53 | 50.94 |
| 2013 | 5,063 | 0.66 | 33 | 97.34 | 50.63 |
| 2012 | 5,030 | 0.74 | 37 | 97.16 | 50.30 |
| 2011 | 4,993 | 0.81 | 40 | 97.01 | 49.93 |
| 2010 | 4,953 | 0.63 | 31 | 96.92 | 49.53 |
| 2005 | 4,777 | -3.61 | -179 | 97.31 | 47.77 |
| 2000 | 4,956 | -51.56 | -5,276 | 98.22 | 49.56 |
| 1995 | 10,232 | -4.68 | -502 | 99.01 | 102.32 |
| 1990 | 10,734 | -5.22 | -591 | 99.59 | 107.34 |
| 1985 | 11,325 | -4.98 | -594 | 99.33 | 113.25 |
| 1980 | 11,919 | 1.18 | 139 | 98.98 | 119.19 |
| 1975 | 11,780 | 1.30 | 151 | 98.40 | 117.80 |
| 1970 | 11,629 | -1.80 | -213 | 97.83 | 116.29 |
| 1965 | 11,842 | -2.15 | -260 | 97.49 | 118.42 |
| 1960 | 12,102 | -15.35 | -2,195 | 99.31 | 121.02 |
| 1955 | 14,297 | 5.74 | 776 | 99.10 | 142.97 |
| 1950 | 13,521 | 98.96 | 135.21 |