Mongolia population
3,435,091
Births this year: 595,016
Births today 61
Deaths this year 191,255
Deaths today 20
3,435,091
| Region Name | Percents | Number |
|---|---|---|
| Buddhist | 53% | 1,606,605 people |
| Muslim | 3% | 90,940 people |
| Christian | 2.2% | 66,689 people |
| Shamanist | 2.9% | 87,909 people |
| other | 0.4% | 12,125 people |
| none | 38.6% | 1,170,093 people |
| Ethnic groups Name | Percents | Number |
|---|---|---|
| Khalkh | 81.9% | 2,482,659 people |
| Kazak | 3.8% | 115,191 people |
| Dorvod | 2.7% | 81,846 people |
| Bayad | 2.1% | 63,658 people |
| Buryat-Bouriates | 1.7% | 51,533 people |
| Zakhchin | 1.2% | 36,376 people |
| Dariganga | 1% | 30,313 people |
| Uriankhai | 1% | 30,313 people |
| other | 4.6% | 139,441 people |
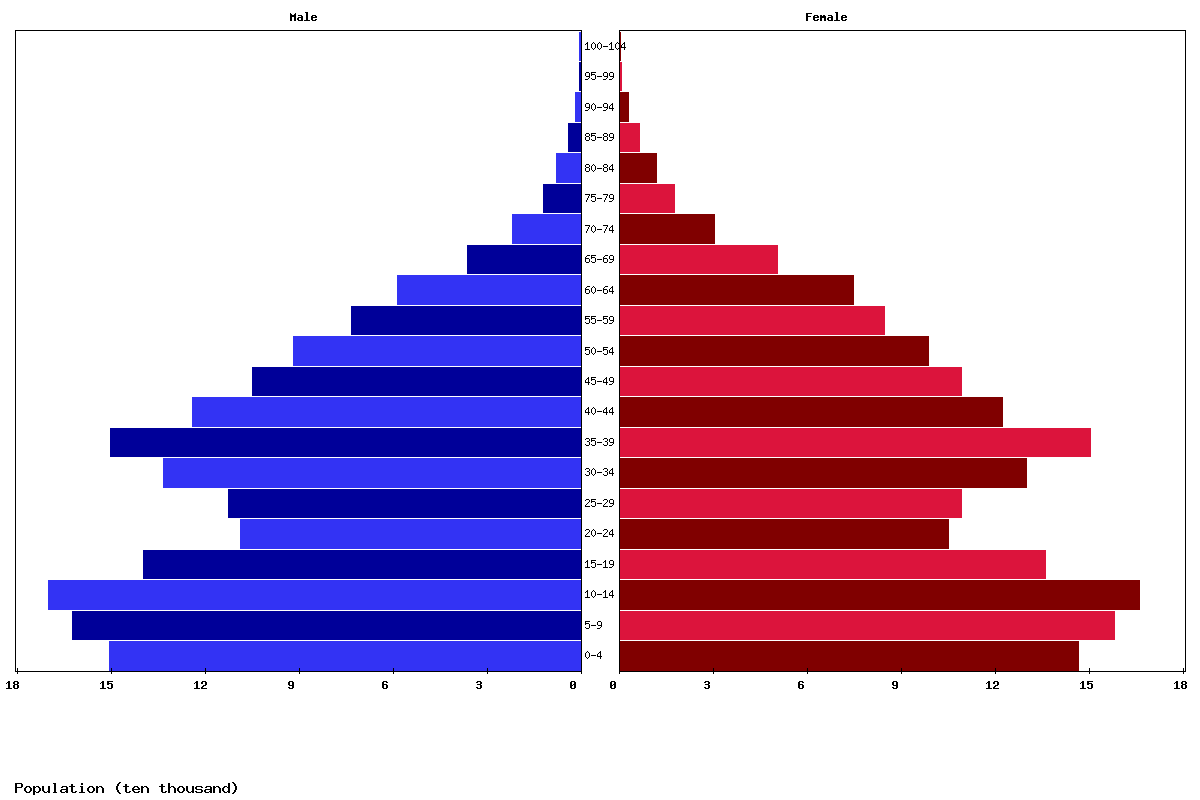
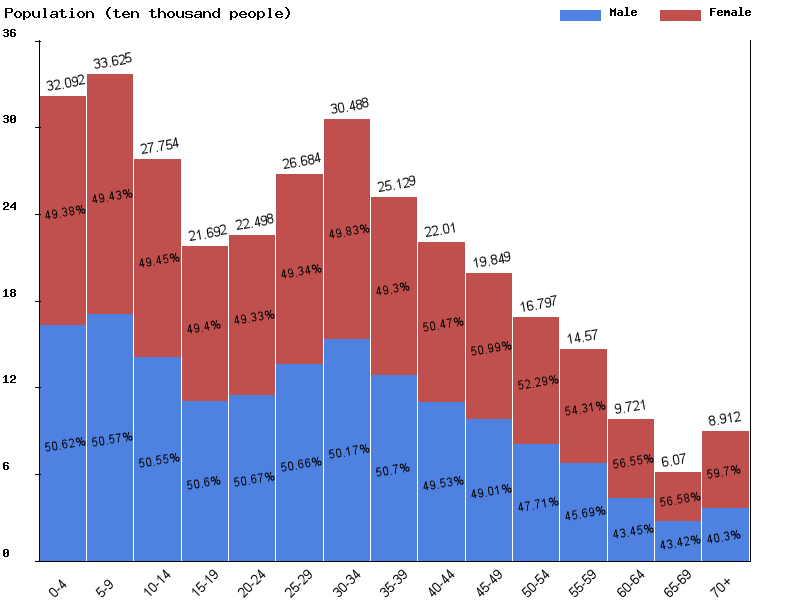
| Age | Both Sexes Population | Male Population | Female Population | Both Sexes (%) | Male (%) | Female (%) | Sex ratio (female/male) |
|---|---|---|---|---|---|---|---|
| Total | 3,363,803 | 1,656,577 | 1,707,226 | 100 | 100 | 100 | 97 |
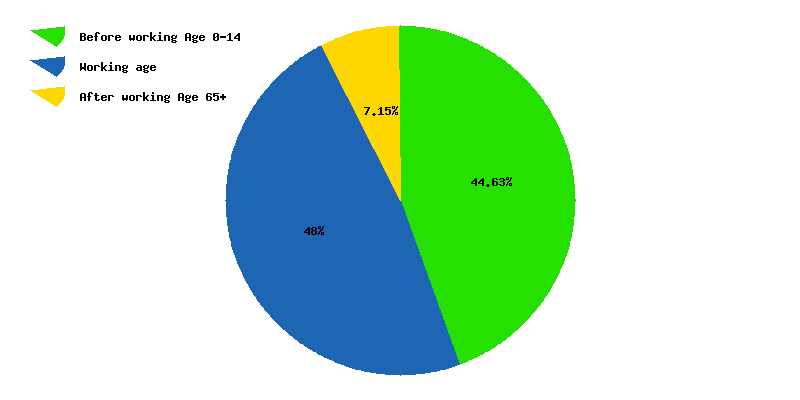
| 00-04 | 296,616 | 150,269 | 146,347 | 8.8 | 9.1 | 8.6 | 102.7 |
| 05-09 | 319,735 | 161,813 | 157,922 | 9.5 | 9.8 | 9.3 | 102.5 |
| 10-14 | 335,423 | 169,587 | 165,836 | 10 | 10.2 | 9.7 | 102.3 |
| 15-19 | 275,385 | 139,444 | 135,941 | 8.2 | 8.4 | 8 | 102.6 |
| 20-24 | 213,378 | 108,386 | 104,992 | 6.3 | 6.5 | 6.1 | 103.2 |
| 25-29 | 221,151 | 112,267 | 108,884 | 6.6 | 6.8 | 6.4 | 103.1 |
| 30-34 | 262,772 | 132,925 | 129,847 | 7.8 | 8 | 7.6 | 102.4 |
| 35-39 | 299,878 | 149,764 | 150,114 | 8.9 | 9 | 8.8 | 99.8 |
| 40-44 | 245,751 | 123,661 | 122,090 | 7.3 | 7.5 | 7.2 | 101.3 |
| 45-49 | 213,349 | 104,455 | 108,894 | 6.3 | 6.3 | 6.4 | 95.9 |
| 50-54 | 189,593 | 91,280 | 98,313 | 5.6 | 5.5 | 5.8 | 92.8 |
| 55-59 | 157,137 | 72,769 | 84,368 | 4.7 | 4.4 | 4.9 | 86.3 |
| 60-64 | 132,731 | 58,295 | 74,436 | 3.9 | 3.5 | 4.4 | 78.3 |
| 65-69 | 86,253 | 35,924 | 50,329 | 2.6 | 2.2 | 2.9 | 71.4 |
| 70-74 | 51,590 | 21,433 | 30,157 | 1.5 | 1.3 | 1.8 | 71.1 |
| 75-79 | 28,837 | 11,589 | 17,248 | 0.9 | 0.7 | 1 | 67.2 |
| 80-84 | 19,107 | 7,420 | 11,687 | 0.6 | 0.4 | 0.7 | 63.5 |
| 85-89 | 10,090 | 3,765 | 6,325 | 0.3 | 0.2 | 0.4 | 59.5 |
| 90-94 | 4,119 | 1,323 | 2,796 | 0.1 | 0.1 | 0.2 | 47.3 |
| 95-99 | 833 | 199 | 634 | 0 | 0 | 0 | 31.4 |
| 100+ | 75 | 9 | 66 | 0 | 0 | 0 | 13.6 |
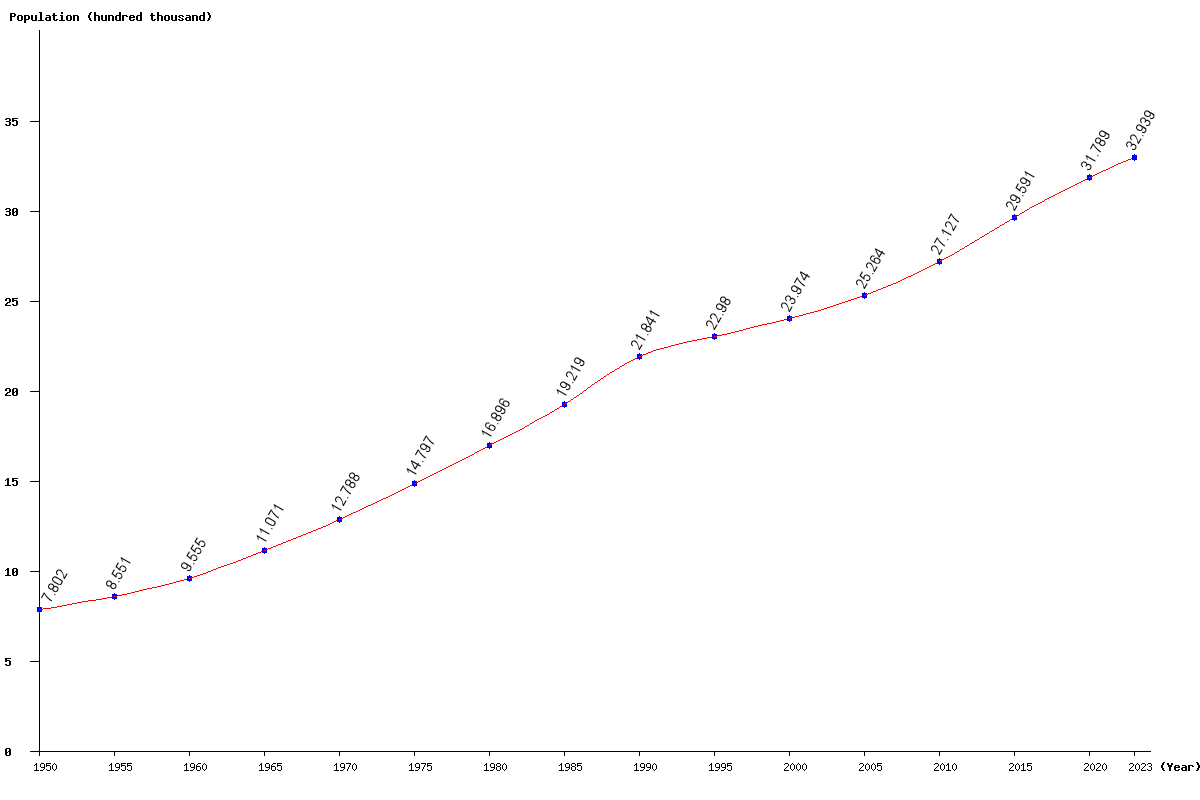
| Year | Population | Yearly % Change |
Yearly Change |
Sex ratio | Density (P/Km²) |
|---|---|---|---|---|---|
| 2025 | 3,363,803 | 1.03 | 34,322 | 97.03 | 2.17 |
| 2024 | 3,329,481 | 1.08 | 35,574 | 97.13 | 2.14 |
| 2023 | 3,293,907 | 1.13 | 36,906 | 97.23 | 2.12 |
| 2022 | 3,257,001 | 1.19 | 38,318 | 97.33 | 2.10 |
| 2021 | 3,218,683 | 1.25 | 39,779 | 97.43 | 2.07 |
| 2020 | 3,178,904 | 1.31 | 41,057 | 97.53 | 2.05 |
| 2019 | 3,137,847 | 1.37 | 42,255 | 97.63 | 2.02 |
| 2018 | 3,095,592 | 1.43 | 43,692 | 97.73 | 1.99 |
| 2017 | 3,051,900 | 1.51 | 45,456 | 97.83 | 1.96 |
| 2016 | 3,006,444 | 1.60 | 47,310 | 97.92 | 1.94 |
| 2015 | 2,959,134 | 1.69 | 49,263 | 98.02 | 1.90 |
| 2014 | 2,909,871 | 1.77 | 50,697 | 98.11 | 1.87 |
| 2013 | 2,859,174 | 1.81 | 50,835 | 98.20 | 1.84 |
| 2012 | 2,808,339 | 1.79 | 49,265 | 98.29 | 1.81 |
| 2011 | 2,759,074 | 1.71 | 46,417 | 98.38 | 1.78 |
| 2010 | 2,712,657 | 1.61 | 43,085 | 98.47 | 1.75 |
| 2005 | 2,526,447 | 5.38 | 129,009 | 99.01 | 1.63 |
| 2000 | 2,397,438 | 4.33 | 99,400 | 99.48 | 1.54 |
| 1995 | 2,298,038 | 5.21 | 113,893 | 98.18 | 1.48 |
| 1990 | 2,184,145 | 13.65 | 262,260 | 97.50 | 1.41 |
| 1985 | 1,921,885 | 13.75 | 232,263 | 97.37 | 1.24 |
| 1980 | 1,689,622 | 14.19 | 209,972 | 97.29 | 1.09 |
| 1975 | 1,479,650 | 15.70 | 200,825 | 97.19 | 0.95 |
| 1970 | 1,278,825 | 15.51 | 171,700 | 97.06 | 0.82 |
| 1965 | 1,107,125 | 15.87 | 151,611 | 96.93 | 0.71 |
| 1960 | 955,514 | 11.74 | 100,413 | 96.74 | 0.62 |
| 1955 | 855,101 | 9.60 | 74,901 | 96.91 | 0.55 |
| 1950 | 780,200 | 96.66 | 0.50 |