Mauritania population
3,677,293
Births this year: 0
Births today 0
Deaths this year 0
Deaths today 0
3,677,293
| Region Name | Percents | Number |
|---|---|---|
| Muslim (official) | 100% | 3,677,293 people |
| Ethnic groups Name | Percents | Number |
|---|---|---|
| black Moors (Haratines - Arab-speaking slaves, former slaves, and their descendants of African origin, enslaved by white Moors) | 40% | 1,470,917 people |
| white Moors (of Arab-Berber descent, known as Bidhan) | 30% | 1,103,188 people |
| black Africans (non-Arabic speaking, Halpulaar, Soninke, Wolof, and Bamara ethnic groups) | 30% | 1,103,188 people |
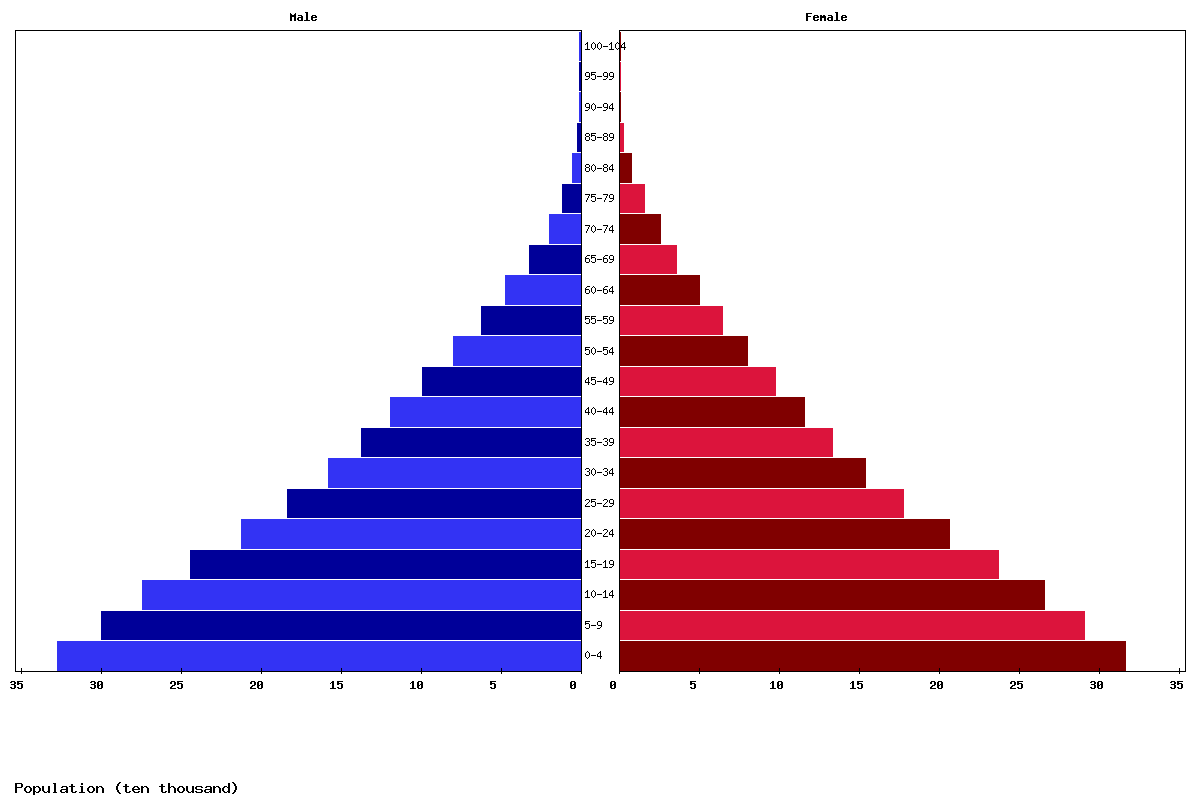
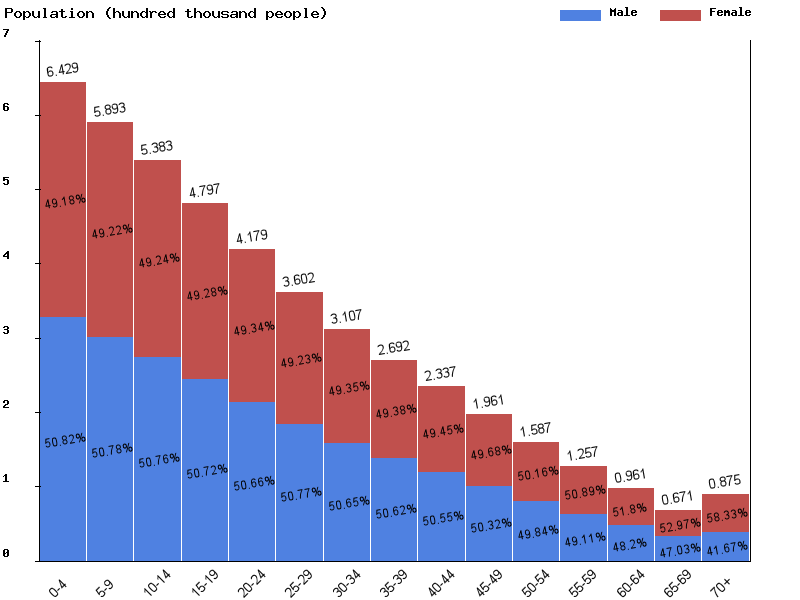
| Age | Both Sexes Population | Male Population | Female Population | Both Sexes (%) | Male (%) | Female (%) | Sex ratio (female/male) |
|---|---|---|---|---|---|---|---|
| Total | 5,106,851 | 2,572,443 | 2,534,408 | 100 | 100 | 100 | 101.5 |
| 00-04 | 685,828 | 348,588 | 337,240 | 13.4 | 13.6 | 13.3 | 103.4 |
| 05-09 | 631,166 | 320,488 | 310,678 | 12.4 | 12.5 | 12.3 | 103.2 |
| 10-14 | 585,113 | 297,159 | 287,954 | 11.5 | 11.6 | 11.4 | 103.2 |
| 15-19 | 533,687 | 270,853 | 262,834 | 10.5 | 10.5 | 10.4 | 103.1 |
| 20-24 | 471,998 | 239,153 | 232,845 | 9.2 | 9.3 | 9.2 | 102.7 |
| 25-29 | 409,236 | 207,057 | 202,179 | 8 | 8 | 8 | 102.4 |
| 30-34 | 352,405 | 178,683 | 173,722 | 6.9 | 6.9 | 6.9 | 102.9 |
| 35-39 | 303,744 | 153,566 | 150,178 | 5.9 | 6 | 5.9 | 102.3 |
| 40-44 | 262,517 | 132,581 | 129,936 | 5.1 | 5.2 | 5.1 | 102 |
| 45-49 | 226,859 | 114,249 | 112,610 | 4.4 | 4.4 | 4.4 | 101.5 |
| 50-54 | 188,638 | 94,312 | 94,326 | 3.7 | 3.7 | 3.7 | 100 |
| 55-59 | 150,314 | 74,141 | 76,173 | 2.9 | 2.9 | 3 | 97.3 |
| 60-64 | 115,938 | 56,101 | 59,837 | 2.3 | 2.2 | 2.4 | 93.8 |
| 65-69 | 84,698 | 40,078 | 44,620 | 1.7 | 1.6 | 1.8 | 89.8 |
| 70-74 | 54,412 | 25,055 | 29,357 | 1.1 | 1 | 1.2 | 85.3 |
| 75-79 | 30,943 | 12,859 | 18,084 | 0.6 | 0.5 | 0.7 | 71.1 |
| 80-84 | 14,169 | 5,596 | 8,573 | 0.3 | 0.2 | 0.3 | 65.3 |
| 85-89 | 4,363 | 1,639 | 2,724 | 0.1 | 0.1 | 0.1 | 60.2 |
| 90-94 | 752 | 263 | 489 | 0 | 0 | 0 | 53.8 |
| 95-99 | 67 | 21 | 46 | 0 | 0 | 0 | 45.7 |
| 100+ | 4 | 1 | 3 | 0 | 0 | 0 | 33.3 |
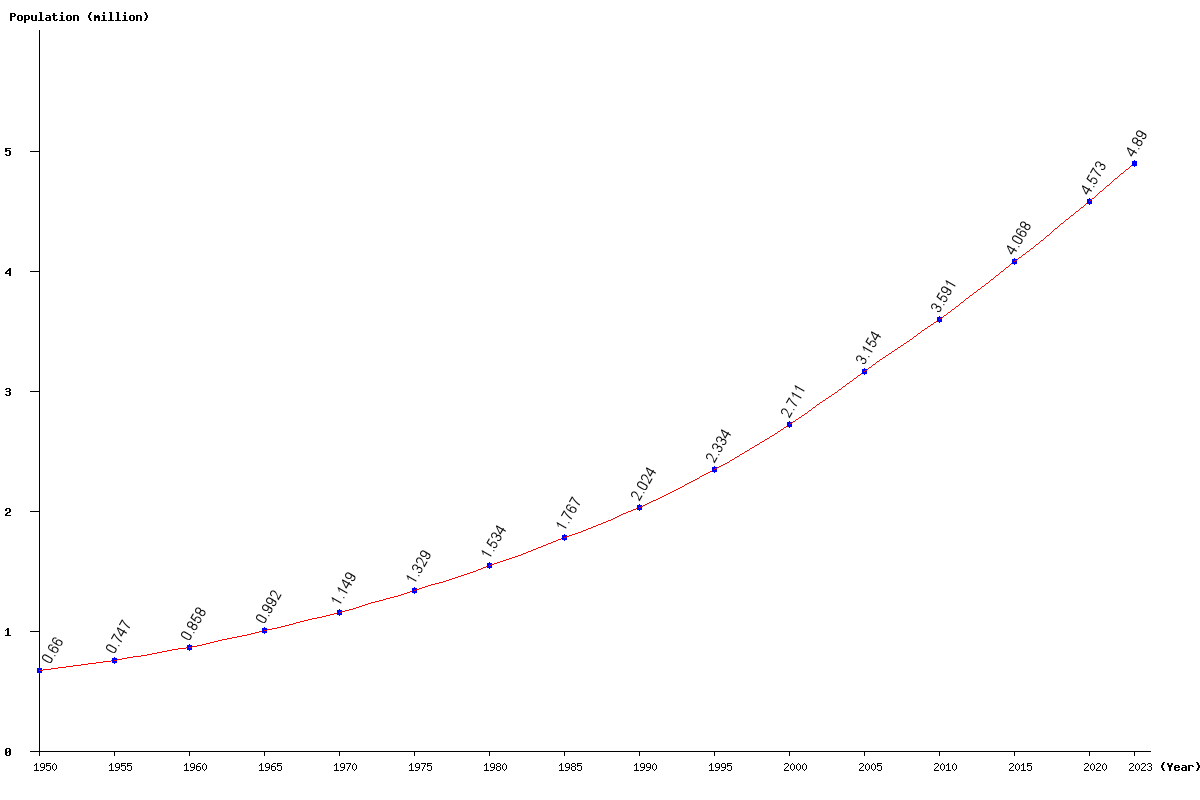
| Year | Population | Yearly % Change |
Yearly Change |
Sex ratio | Density (P/Km²) |
|---|---|---|---|---|---|
| 2025 | 5,106,851 | 2.18 | 108,908 | 101.50 | 4.95 |
| 2024 | 4,997,943 | 2.21 | 107,837 | 101.49 | 4.85 |
| 2023 | 4,890,106 | 2.23 | 106,751 | 101.48 | 4.74 |
| 2022 | 4,783,355 | 2.26 | 105,654 | 101.47 | 4.64 |
| 2021 | 4,677,701 | 2.29 | 104,544 | 101.45 | 4.54 |
| 2020 | 4,573,157 | 2.31 | 103,397 | 101.43 | 4.44 |
| 2019 | 4,469,760 | 2.34 | 102,227 | 101.41 | 4.34 |
| 2018 | 4,367,533 | 2.37 | 101,085 | 101.38 | 4.24 |
| 2017 | 4,266,448 | 2.40 | 99,985 | 101.35 | 4.14 |
| 2016 | 4,166,463 | 2.43 | 98,899 | 101.32 | 4.04 |
| 2015 | 4,067,564 | 2.47 | 97,939 | 101.29 | 3.95 |
| 2014 | 3,969,625 | 2.50 | 96,941 | 101.25 | 3.85 |
| 2013 | 3,872,684 | 2.53 | 95,617 | 101.20 | 3.76 |
| 2012 | 3,777,067 | 2.55 | 93,846 | 101.16 | 3.66 |
| 2011 | 3,683,221 | 2.56 | 91,821 | 101.11 | 3.57 |
| 2010 | 3,591,400 | 2.55 | 89,473 | 101.07 | 3.48 |
| 2005 | 3,154,087 | 16.33 | 442,666 | 100.87 | 3.06 |
| 2000 | 2,711,421 | 16.17 | 377,455 | 100.28 | 2.63 |
| 1995 | 2,333,966 | 15.33 | 310,301 | 99.70 | 2.26 |
| 1990 | 2,023,665 | 14.53 | 256,810 | 99.43 | 1.96 |
| 1985 | 1,766,855 | 15.17 | 232,770 | 99.34 | 1.71 |
| 1980 | 1,534,085 | 15.46 | 205,398 | 99.28 | 1.49 |
| 1975 | 1,328,687 | 15.65 | 179,779 | 99.17 | 1.29 |
| 1970 | 1,148,908 | 15.77 | 156,540 | 99.11 | 1.11 |
| 1965 | 992,368 | 15.64 | 134,198 | 98.80 | 0.96 |
| 1960 | 858,170 | 14.91 | 111,366 | 98.15 | 0.83 |
| 1955 | 746,804 | 13.07 | 86,313 | 97.10 | 0.72 |
| 1950 | 660,491 | 95.80 | 0.64 |