Marshall Islands population
88,210
Births this year: 17,829
Births today 2
Deaths this year 2,995
Deaths today 0
88,210
| Region Name | Percents | Number |
|---|---|---|
| Protestant | 54.8% | 40,210 people |
| Assembly of God | 25.8% | 18,931 people |
| Roman Catholic | 8.4% | 6,164 people |
| Bukot nan Jesus | 2.8% | 2,055 people |
| Mormon | 2.1% | 1,541 people |
| other Christian | 3.6% | 2,642 people |
| other | 1% | 734 people |
| none | 1.5% | 1,101 people |
| Ethnic groups Name | Percents | Number |
|---|---|---|
| Marshallese | 92.1% | 67,579 people |
| mixed Marshallese | 5.9% | 4,329 people |
| other | 2% | 1,468 people |
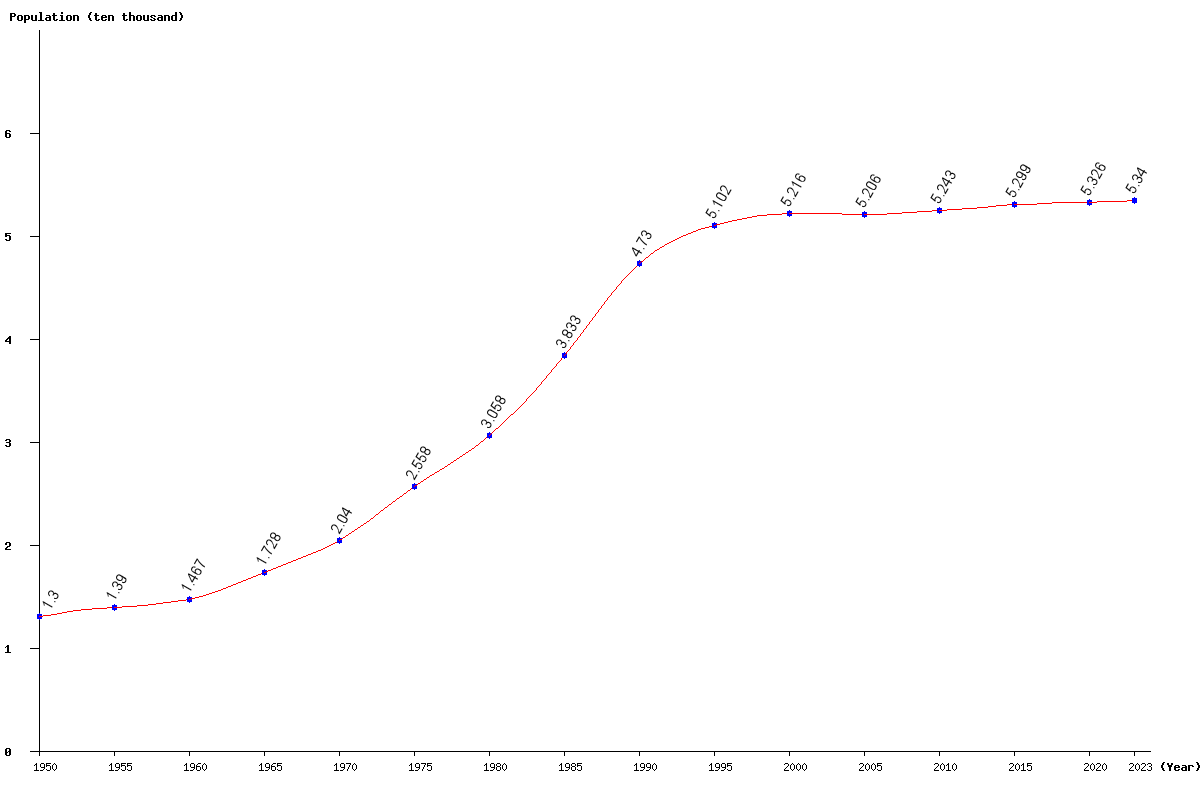
| Year | Population | Yearly % Change |
Yearly Change |
Sex ratio | Density (P/Km²) |
|---|---|---|---|---|---|
| 2025 | 53,682 | 0.33 | 175 | 101.46 | 298.23 |
| 2024 | 53,507 | 0.20 | 109 | 101.42 | 297.26 |
| 2023 | 53,398 | 0.11 | 61 | 101.37 | 296.66 |
| 2022 | 53,337 | 0.07 | 39 | 101.31 | 296.32 |
| 2021 | 53,298 | 0.07 | 35 | 101.25 | 296.10 |
| 2020 | 53,263 | 0.07 | 39 | 101.18 | 295.91 |
| 2019 | 53,224 | 0.08 | 42 | 101.09 | 295.69 |
| 2018 | 53,182 | 0.09 | 50 | 101.00 | 295.46 |
| 2017 | 53,132 | 0.12 | 63 | 100.89 | 295.18 |
| 2016 | 53,069 | 0.14 | 76 | 100.77 | 294.83 |
| 2015 | 52,993 | 0.18 | 95 | 100.64 | 294.41 |
| 2014 | 52,898 | 0.21 | 112 | 100.50 | 293.88 |
| 2013 | 52,786 | 0.23 | 123 | 100.35 | 293.26 |
| 2012 | 52,663 | 0.23 | 122 | 100.19 | 292.57 |
| 2011 | 52,541 | 0.22 | 113 | 100.02 | 291.89 |
| 2010 | 52,428 | 0.20 | 107 | 99.84 | 291.27 |
| 2005 | 52,058 | -0.20 | -103 | 98.84 | 289.21 |
| 2000 | 52,161 | 2.24 | 1,141 | 97.79 | 289.78 |
| 1995 | 51,020 | 7.86 | 3,720 | 97.87 | 283.44 |
| 1990 | 47,300 | 23.39 | 8,966 | 97.41 | 262.78 |
| 1985 | 38,334 | 25.35 | 7,753 | 95.09 | 212.97 |
| 1980 | 30,581 | 19.55 | 5,001 | 93.47 | 169.89 |
| 1975 | 25,580 | 25.41 | 5,183 | 91.37 | 142.11 |
| 1970 | 20,397 | 18.02 | 3,114 | 89.79 | 113.32 |
| 1965 | 17,283 | 17.85 | 2,618 | 88.53 | 96.02 |
| 1960 | 14,665 | 5.51 | 766 | 86.56 | 81.47 |
| 1955 | 13,899 | 6.92 | 899 | 85.29 | 77.22 |
| 1950 | 13,000 | 84.68 | 72.22 |