Malaysia population
35,367,089
Births this year: 5,992,466
Births today 1,333
Deaths this year 1,575,339
Deaths today 351
35,367,089
| Region Name | Percents | Number |
|---|---|---|
| Muslim (official) | 61.3% | 18,972,327 people |
| Buddhist | 19.8% | 6,128,092 people |
| Christian | 9.2% | 2,847,397 people |
| Hindu | 6.3% | 1,949,848 people |
| Confucianism, Taoism, other traditional Chinese religions | 1.3% | 402,350 people |
| other | 0.4% | 123,800 people |
| none | 0.8% | 247,600 people |
| unspecified | 1% | 309,500 people |
| Ethnic groups Name | Percents | Number |
|---|---|---|
| Malay | 50.1% | 15,505,931 people |
| Chinese | 22.6% | 6,994,691 people |
| indigenous | 11.8% | 3,652,096 people |
| Indian | 6.7% | 2,073,647 people |
| other | 0.7% | 216,650 people |
| non-citizens | 8.2% | 2,537,897 people |
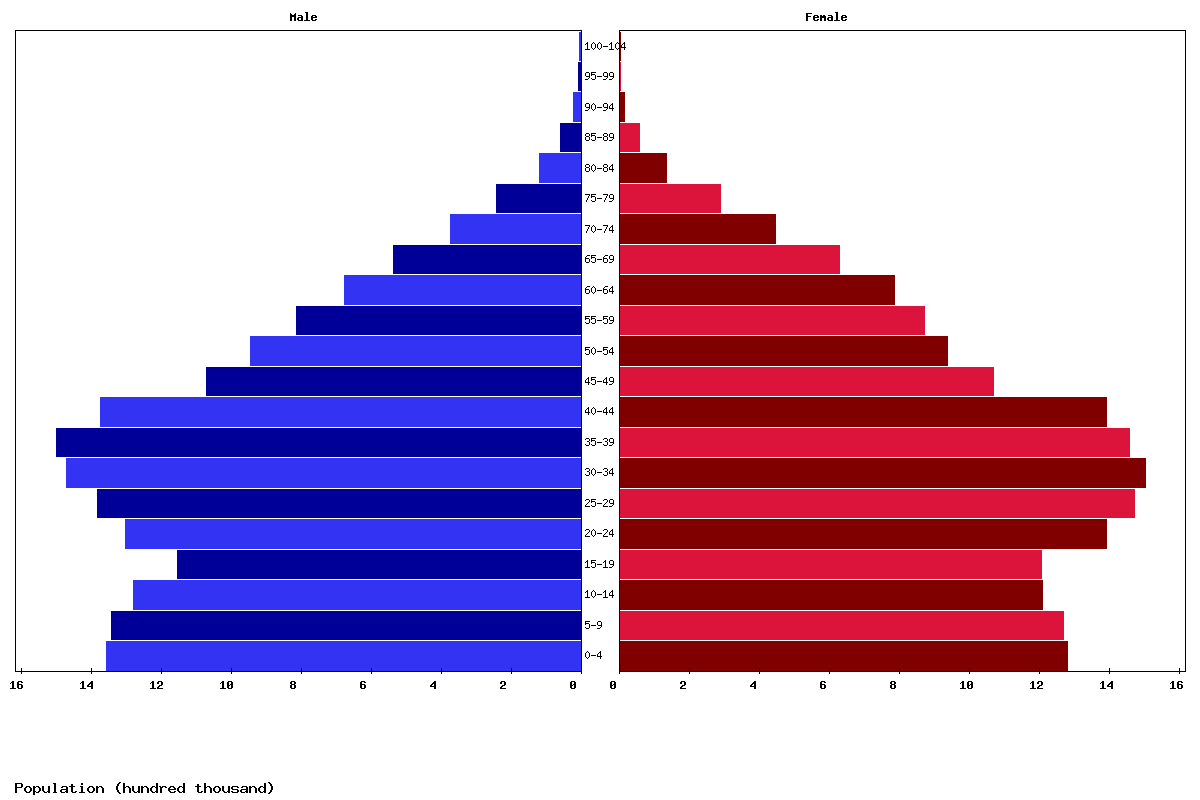
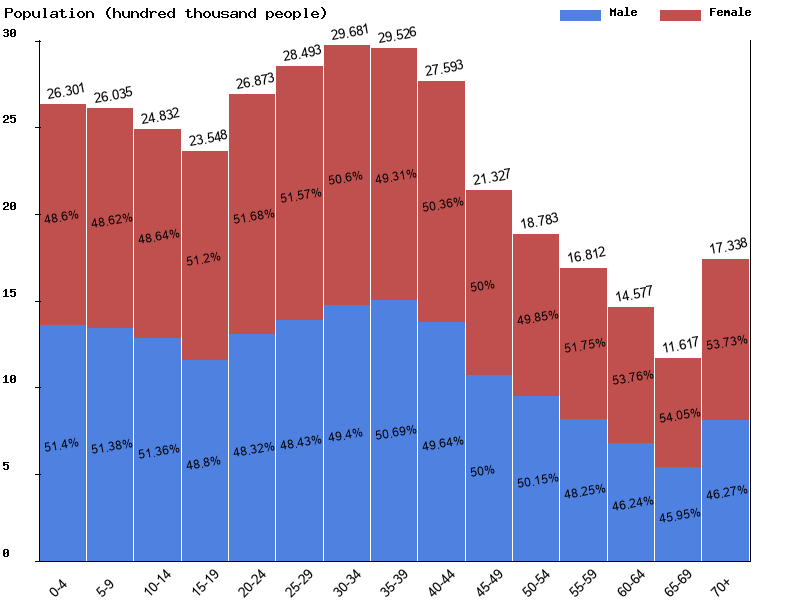
| Age | Both Sexes Population | Male Population | Female Population | Both Sexes (%) | Male (%) | Female (%) | Sex ratio (female/male) |
|---|---|---|---|---|---|---|---|
| Total | 34,333,554 | 16,954,644 | 17,378,910 | 100 | 100 | 100 | 97.6 |
| 00-04 | 2,630,078 | 1,351,757 | 1,278,321 | 7.7 | 8 | 7.4 | 105.7 |
| 05-09 | 2,603,522 | 1,337,745 | 1,265,777 | 7.6 | 7.9 | 7.3 | 105.7 |
| 10-14 | 2,483,218 | 1,275,350 | 1,207,868 | 7.2 | 7.5 | 7 | 105.6 |
| 15-19 | 2,354,791 | 1,149,247 | 1,205,544 | 6.9 | 6.8 | 6.9 | 95.3 |
| 20-24 | 2,687,286 | 1,298,616 | 1,388,670 | 7.8 | 7.7 | 8 | 93.5 |
| 25-29 | 2,849,262 | 1,379,814 | 1,469,448 | 8.3 | 8.1 | 8.5 | 93.9 |
| 30-34 | 2,968,105 | 1,466,253 | 1,501,852 | 8.6 | 8.6 | 8.6 | 97.6 |
| 35-39 | 2,952,560 | 1,496,570 | 1,455,990 | 8.6 | 8.8 | 8.4 | 102.8 |
| 40-44 | 2,759,294 | 1,369,594 | 1,389,700 | 8 | 8.1 | 8 | 98.6 |
| 45-49 | 2,132,672 | 1,066,341 | 1,066,331 | 6.2 | 6.3 | 6.1 | 100 |
| 50-54 | 1,878,348 | 942,042 | 936,306 | 5.5 | 5.6 | 5.4 | 100.6 |
| 55-59 | 1,681,212 | 811,251 | 869,961 | 4.9 | 4.8 | 5 | 93.3 |
| 60-64 | 1,457,683 | 674,037 | 783,646 | 4.2 | 4 | 4.5 | 86 |
| 65-69 | 1,161,718 | 533,794 | 627,924 | 3.4 | 3.1 | 3.6 | 85 |
| 70-74 | 813,935 | 368,890 | 445,045 | 2.4 | 2.2 | 2.6 | 82.9 |
| 75-79 | 524,136 | 238,375 | 285,761 | 1.5 | 1.4 | 1.6 | 83.4 |
| 80-84 | 247,745 | 115,712 | 132,033 | 0.7 | 0.7 | 0.8 | 87.6 |
| 85-89 | 111,372 | 57,007 | 54,365 | 0.3 | 0.3 | 0.3 | 104.9 |
| 90-94 | 30,767 | 18,377 | 12,390 | 0.1 | 0.1 | 0.1 | 148.3 |
| 95-99 | 5,325 | 3,506 | 1,819 | 0 | 0 | 0 | 192.7 |
| 100+ | 525 | 366 | 159 | 0 | 0 | 0 | 230.2 |
| Year | Population | Yearly % Change |
Yearly Change |
Sex ratio | Density (P/Km²) |
|---|---|---|---|---|---|
| 2025 | 34,333,554 | 1.12 | 380,384 | 97.56 | 104.50 |
| 2024 | 33,953,170 | 1.16 | 387,874 | 97.61 | 103.34 |
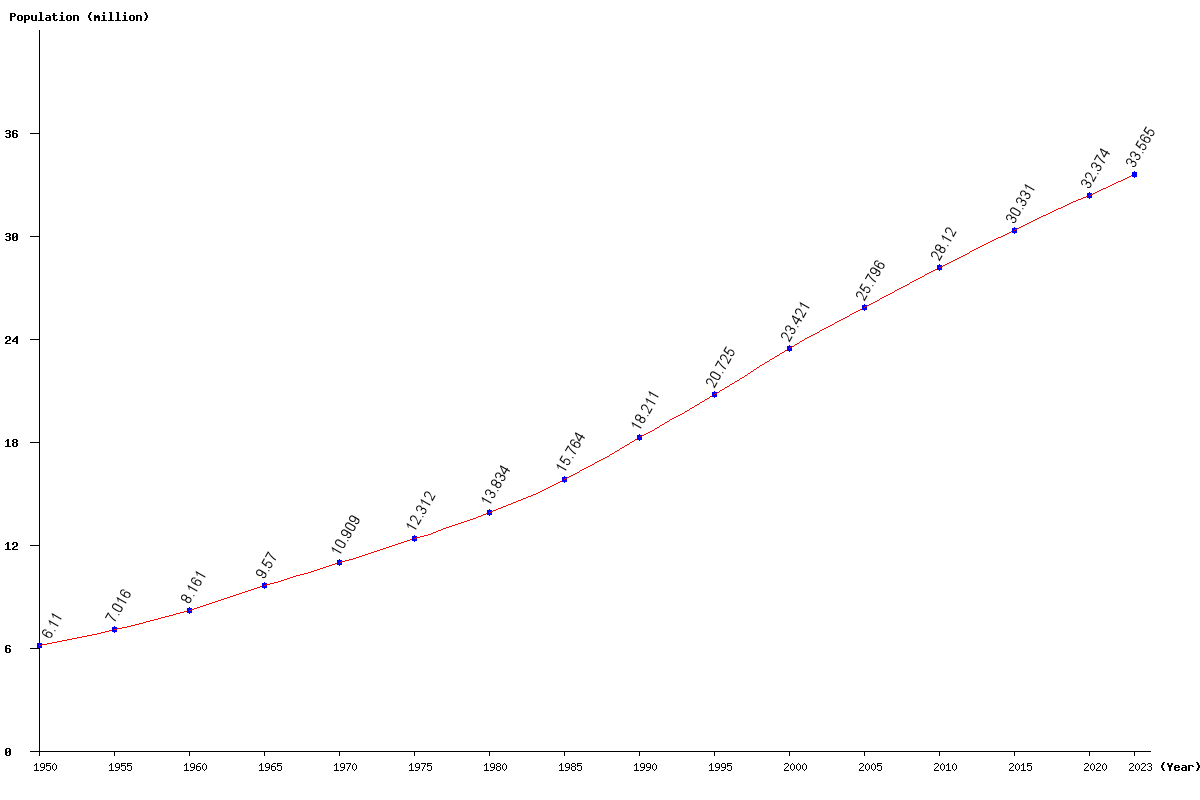
| 2023 | 33,565,296 | 1.19 | 393,685 | 97.66 | 102.16 |
| 2022 | 33,171,611 | 1.21 | 397,415 | 97.72 | 100.96 |
| 2021 | 32,774,196 | 1.23 | 399,722 | 97.77 | 99.75 |
| 2020 | 32,374,474 | 1.25 | 401,057 | 97.84 | 98.54 |
| 2019 | 31,973,417 | 1.28 | 402,841 | 97.90 | 97.32 |
| 2018 | 31,570,576 | 1.30 | 406,399 | 97.98 | 96.09 |
| 2017 | 31,164,177 | 1.34 | 412,575 | 98.06 | 94.85 |
| 2016 | 30,751,602 | 1.39 | 420,595 | 98.13 | 93.60 |
| 2015 | 30,331,007 | 1.43 | 429,010 | 98.17 | 92.32 |
| 2014 | 29,901,997 | 1.48 | 436,625 | 98.18 | 91.01 |
| 2013 | 29,465,372 | 1.53 | 443,432 | 98.17 | 89.68 |
| 2012 | 29,021,940 | 1.57 | 448,970 | 98.19 | 88.33 |
| 2011 | 28,572,970 | 1.61 | 453,470 | 98.29 | 86.97 |
| 2010 | 28,119,500 | 1.66 | 458,483 | 98.54 | 85.59 |
| 2005 | 25,796,124 | 10.14 | 2,375,373 | 101.52 | 78.52 |
| 2000 | 23,420,751 | 13.01 | 2,695,377 | 103.46 | 71.29 |
| 1995 | 20,725,374 | 13.81 | 2,514,277 | 103.28 | 63.08 |
| 1990 | 18,211,097 | 15.52 | 2,446,757 | 103.10 | 55.43 |
| 1985 | 15,764,340 | 13.96 | 1,930,601 | 101.71 | 47.98 |
| 1980 | 13,833,739 | 12.36 | 1,521,957 | 101.55 | 42.11 |
| 1975 | 12,311,782 | 12.86 | 1,403,148 | 101.51 | 37.47 |
| 1970 | 10,908,634 | 13.99 | 1,338,850 | 102.11 | 33.20 |
| 1965 | 9,569,784 | 17.26 | 1,408,809 | 103.05 | 29.13 |
| 1960 | 8,160,975 | 16.32 | 1,144,878 | 103.47 | 24.84 |
| 1955 | 7,016,097 | 14.83 | 906,190 | 104.10 | 21.35 |
| 1950 | 6,109,907 | 106.03 | 18.60 |