Malawi population
1,795,629
Births this year: 0
Births today 0
Deaths this year 61,403
Deaths today 3
1,795,629
| Region Name | Percents | Number |
|---|---|---|
| Christian | 82.6% | 1,533,908 people |
| Muslim | 13% | 241,414 people |
| other | 1.9% | 35,284 people |
| none | 2.5% | 46,426 people |
| Ethnic groups Name | Percents | Number |
|---|---|---|
| Chewa | 32.6% | 605,392 people |
| Lomwe | 17.6% | 326,838 people |
| Yao | 13.5% | 250,699 people |
| Ngoni | 11.5% | 213,559 people |
| Tumbuka | 8.8% | 163,419 people |
| Nyanja | 5.8% | 107,708 people |
| Sena | 3.6% | 66,853 people |
| Tonga | 2.1% | 38,998 people |
| Ngonde | 1% | 18,570 people |
| other | 3.5% | 64,996 people |
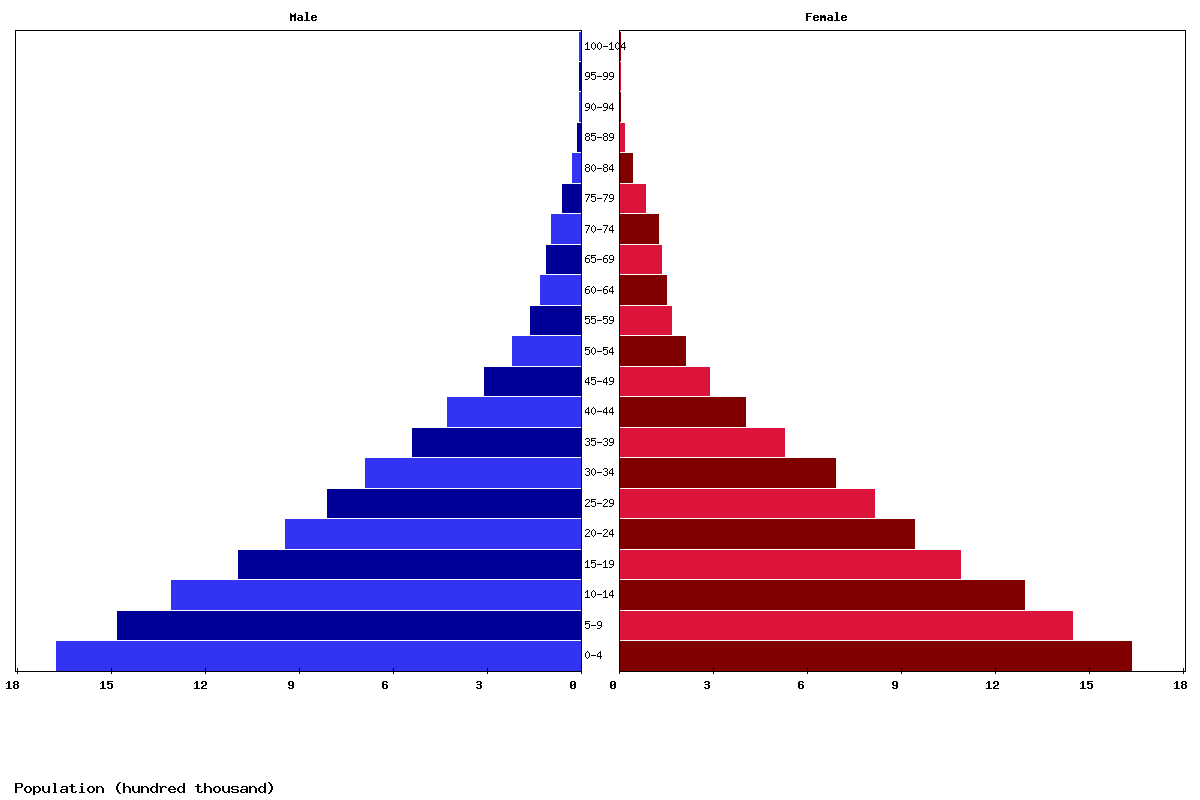
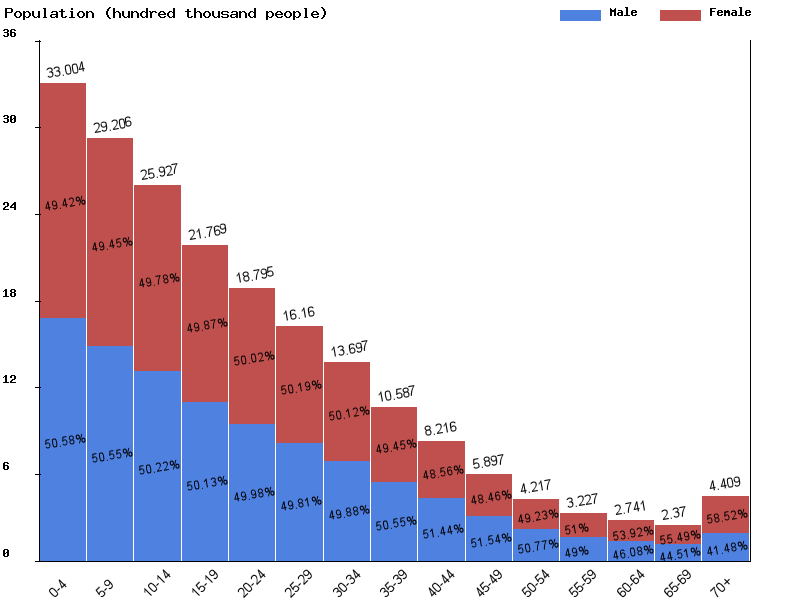
| Age | Both Sexes Population | Male Population | Female Population | Both Sexes (%) | Male (%) | Female (%) | Sex ratio (female/male) |
|---|---|---|---|---|---|---|---|
| Total | 23,134,168 | 11,589,010 | 11,545,158 | 100 | 100 | 100 | 100.4 |
| 00-04 | 3,629,668 | 1,836,187 | 1,793,481 | 15.7 | 15.8 | 15.5 | 102.4 |
| 05-09 | 3,271,623 | 1,654,578 | 1,617,045 | 14.1 | 14.3 | 14 | 102.3 |
| 10-14 | 2,906,684 | 1,469,066 | 1,437,618 | 12.6 | 12.7 | 12.5 | 102.2 |
| 15-19 | 2,565,915 | 1,288,049 | 1,277,866 | 11.1 | 11.1 | 11.1 | 100.8 |
| 20-24 | 2,150,366 | 1,076,999 | 1,073,367 | 9.3 | 9.3 | 9.3 | 100.3 |
| 25-29 | 1,849,653 | 924,526 | 925,127 | 8 | 8 | 8 | 99.9 |
| 30-34 | 1,582,160 | 789,488 | 792,672 | 6.8 | 6.8 | 6.9 | 99.6 |
| 35-39 | 1,331,961 | 666,153 | 665,808 | 5.8 | 5.7 | 5.8 | 100.1 |
| 40-44 | 1,022,624 | 517,776 | 504,848 | 4.4 | 4.5 | 4.4 | 102.6 |
| 45-49 | 792,854 | 407,088 | 385,766 | 3.4 | 3.5 | 3.3 | 105.5 |
| 50-54 | 567,942 | 290,814 | 277,128 | 2.5 | 2.5 | 2.4 | 104.9 |
| 55-59 | 404,024 | 202,654 | 201,370 | 1.7 | 1.7 | 1.7 | 100.6 |
| 60-64 | 305,554 | 147,109 | 158,445 | 1.3 | 1.3 | 1.4 | 92.8 |
| 65-69 | 253,611 | 114,146 | 139,465 | 1.1 | 1 | 1.2 | 81.8 |
| 70-74 | 208,260 | 89,822 | 118,438 | 0.9 | 0.8 | 1 | 75.8 |
| 75-79 | 168,224 | 68,908 | 99,316 | 0.7 | 0.6 | 0.9 | 69.4 |
| 80-84 | 87,420 | 33,573 | 53,847 | 0.4 | 0.3 | 0.5 | 62.3 |
| 85-89 | 29,351 | 10,186 | 19,165 | 0.1 | 0.1 | 0.2 | 53.1 |
| 90-94 | 5,689 | 1,746 | 3,943 | 0 | 0 | 0 | 44.3 |
| 95-99 | 561 | 137 | 424 | 0 | 0 | 0 | 32.3 |
| 100+ | 24 | 5 | 19 | 0 | 0 | 0 | 26.3 |
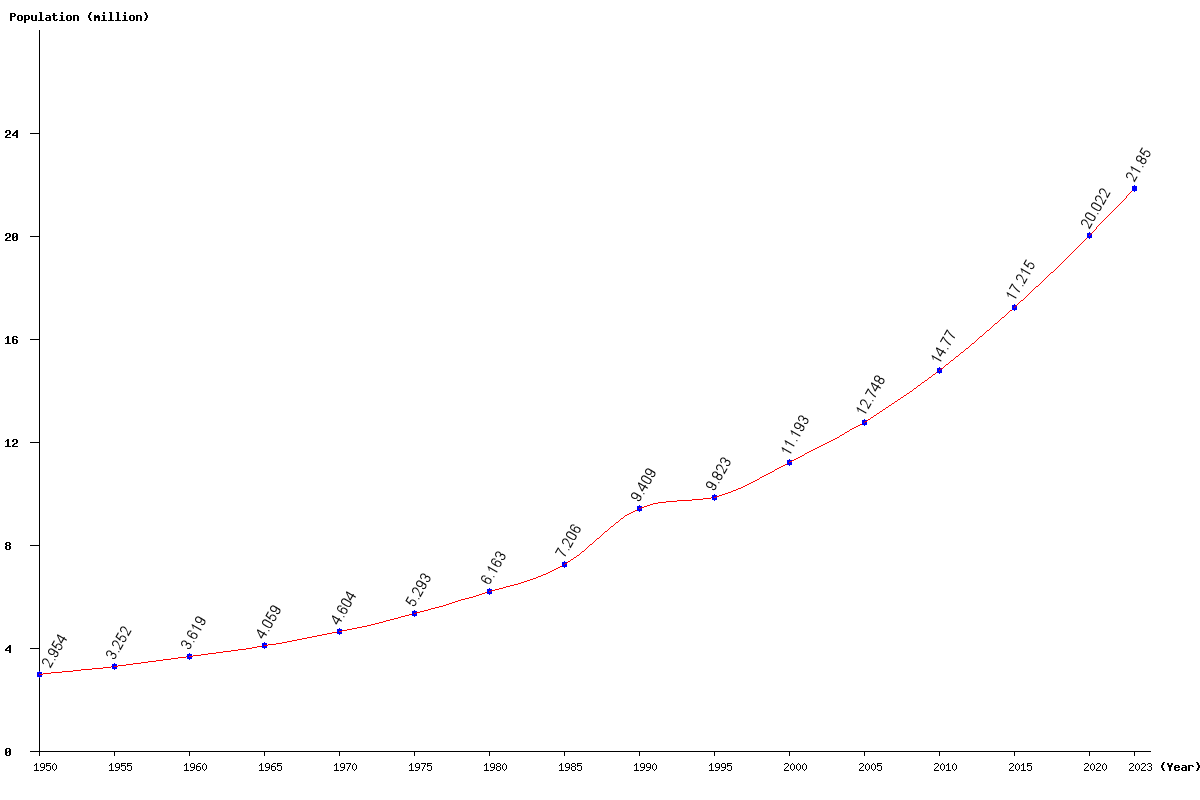
| Year | Population | Yearly % Change |
Yearly Change |
Sex ratio | Density (P/Km²) |
|---|---|---|---|---|---|
| 2025 | 23,134,168 | 2.89 | 648,962 | 100.38 | 245.38 |
| 2024 | 22,485,206 | 2.90 | 634,709 | 100.33 | 238.49 |
| 2023 | 21,850,497 | 2.93 | 621,302 | 100.28 | 231.76 |
| 2022 | 21,229,195 | 2.95 | 609,136 | 100.22 | 225.17 |
| 2021 | 20,620,059 | 2.99 | 597,791 | 100.16 | 218.71 |
| 2020 | 20,022,268 | 3.02 | 586,551 | 100.09 | 212.37 |
| 2019 | 19,435,717 | 3.05 | 574,754 | 100.01 | 206.15 |
| 2018 | 18,860,963 | 3.07 | 562,284 | 99.93 | 200.05 |
| 2017 | 18,298,679 | 3.09 | 548,853 | 99.84 | 194.09 |
| 2016 | 17,749,826 | 3.11 | 534,594 | 99.75 | 188.27 |
| 2015 | 17,215,232 | 3.11 | 519,979 | 99.66 | 182.60 |
| 2014 | 16,695,253 | 3.12 | 505,127 | 99.57 | 177.08 |
| 2013 | 16,190,126 | 3.12 | 489,690 | 99.48 | 171.72 |
| 2012 | 15,700,436 | 3.11 | 473,623 | 99.39 | 166.53 |
| 2011 | 15,226,813 | 3.09 | 456,989 | 99.30 | 161.51 |
| 2010 | 14,769,824 | 3.08 | 440,768 | 99.23 | 156.66 |
| 2005 | 12,747,846 | 13.89 | 1,554,616 | 99.00 | 135.21 |
| 2000 | 11,193,230 | 13.95 | 1,370,418 | 98.37 | 118.72 |
| 1995 | 9,822,812 | 4.40 | 413,814 | 97.92 | 104.19 |
| 1990 | 9,408,998 | 30.58 | 2,203,363 | 96.60 | 99.80 |
| 1985 | 7,205,635 | 16.91 | 1,042,410 | 96.63 | 76.43 |
| 1980 | 6,163,225 | 16.45 | 870,409 | 95.97 | 65.37 |
| 1975 | 5,292,816 | 14.97 | 689,077 | 95.24 | 56.14 |
| 1970 | 4,603,739 | 13.43 | 545,059 | 94.65 | 48.83 |
| 1965 | 4,058,680 | 12.16 | 440,076 | 94.22 | 43.05 |
| 1960 | 3,618,604 | 11.26 | 366,263 | 93.84 | 38.38 |
| 1955 | 3,252,341 | 10.10 | 298,470 | 93.21 | 34.50 |
| 1950 | 2,953,871 | 92.32 | 31.33 |