Liberia population
4,299,944
Births this year: 0
Births today 0
Deaths this year 0
Deaths today 0
4,299,944
| Region Name | Percents | Number |
|---|---|---|
| Christian | 85.6% | 3,680,752 people |
| Muslim | 12.2% | 524,593 people |
| Traditional | 0.6% | 25,800 people |
| other | 0.2% | 8,600 people |
| none | 1.4% | 60,199 people |
| Ethnic groups Name | Percents | Number |
|---|---|---|
| Kpelle | 20.3% | 872,889 people |
| Bassa | 13.4% | 576,192 people |
| Grebo | 10% | 429,994 people |
| Gio | 8% | 343,996 people |
| Mano | 7.9% | 339,696 people |
| Kru | 6% | 257,997 people |
| Lorma | 5.1% | 219,297 people |
| Kissi | 4.8% | 206,397 people |
| Gola | 4.4% | 189,198 people |
| other | 20.1% | 864,289 people |
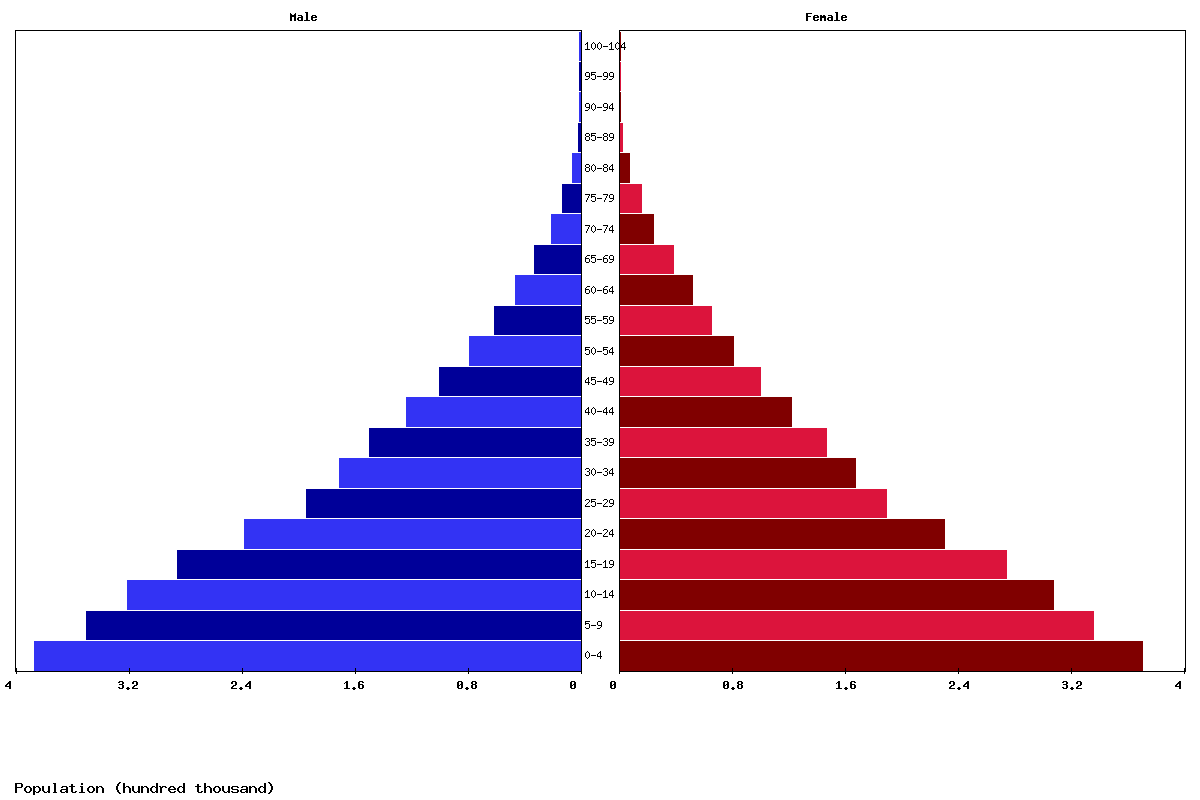
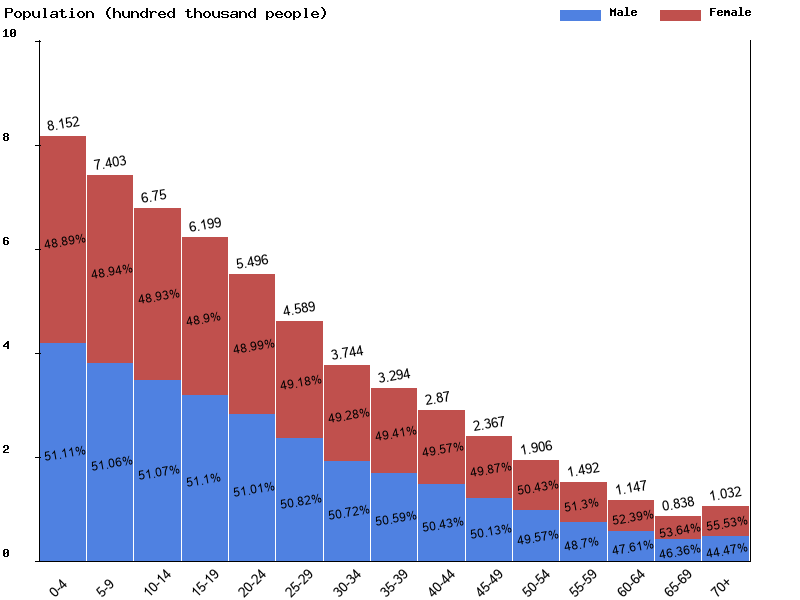
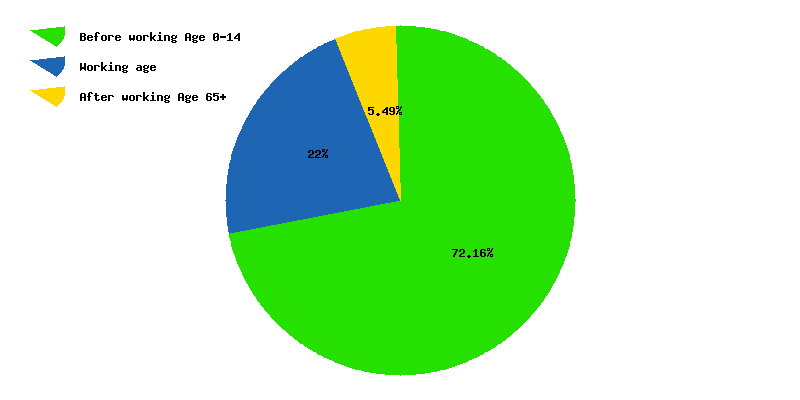
| Age | Both Sexes Population | Male Population | Female Population | Both Sexes (%) | Male (%) | Female (%) | Sex ratio (female/male) |
|---|---|---|---|---|---|---|---|
| Total | 5,727,990 | 2,896,245 | 2,831,745 | 100 | 100 | 100 | 102.3 |
| 00-04 | 815,229 | 416,642 | 398,587 | 14.2 | 14.4 | 14.1 | 104.5 |
| 05-09 | 740,325 | 378,022 | 362,303 | 12.9 | 13.1 | 12.8 | 104.3 |
| 10-14 | 675,026 | 344,746 | 330,280 | 11.8 | 11.9 | 11.7 | 104.4 |
| 15-19 | 619,920 | 316,797 | 303,123 | 10.8 | 10.9 | 10.7 | 104.5 |
| 20-24 | 549,589 | 280,353 | 269,236 | 9.6 | 9.7 | 9.5 | 104.1 |
| 25-29 | 458,893 | 233,231 | 225,662 | 8 | 8.1 | 8 | 103.4 |
| 30-34 | 374,433 | 189,914 | 184,519 | 6.5 | 6.6 | 6.5 | 102.9 |
| 35-39 | 329,405 | 166,656 | 162,749 | 5.8 | 5.8 | 5.7 | 102.4 |
| 40-44 | 287,039 | 144,758 | 142,281 | 5 | 5 | 5 | 101.7 |
| 45-49 | 236,719 | 118,661 | 118,058 | 4.1 | 4.1 | 4.2 | 100.5 |
| 50-54 | 190,577 | 94,469 | 96,108 | 3.3 | 3.3 | 3.4 | 98.3 |
| 55-59 | 149,167 | 72,650 | 76,517 | 2.6 | 2.5 | 2.7 | 94.9 |
| 60-64 | 114,691 | 54,610 | 60,081 | 2 | 1.9 | 2.1 | 90.9 |
| 65-69 | 83,806 | 38,855 | 44,951 | 1.5 | 1.3 | 1.6 | 86.4 |
| 70-74 | 55,076 | 24,752 | 30,324 | 1 | 0.9 | 1.1 | 81.6 |
| 75-79 | 29,570 | 13,163 | 16,407 | 0.5 | 0.5 | 0.6 | 80.2 |
| 80-84 | 14,057 | 6,136 | 7,921 | 0.2 | 0.2 | 0.3 | 77.5 |
| 85-89 | 3,849 | 1,595 | 2,254 | 0.1 | 0.1 | 0.1 | 70.8 |
| 90-94 | 570 | 218 | 352 | 0 | 0 | 0 | 61.9 |
| 95-99 | 46 | 16 | 30 | 0 | 0 | 0 | 53.3 |
| 100+ | 3 | 1 | 2 | 0 | 0 | 0 | 50 |
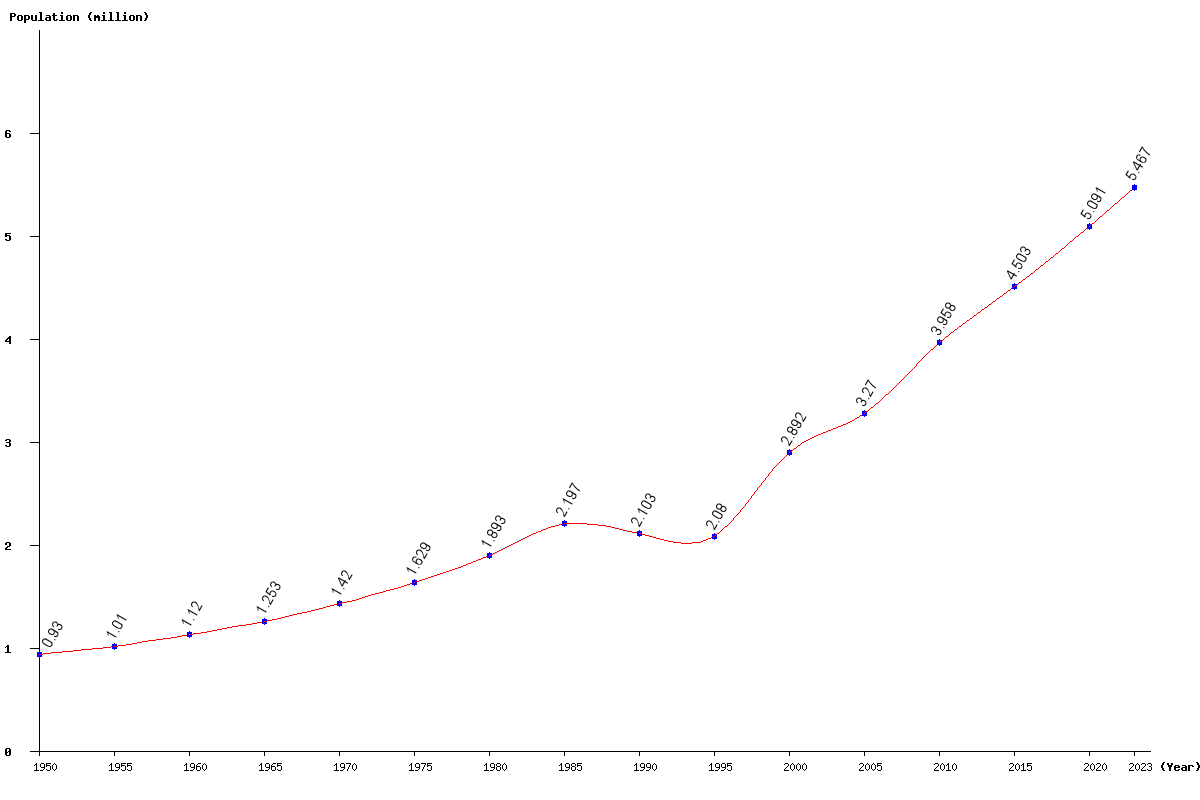
| Year | Population | Yearly % Change |
Yearly Change |
Sex ratio | Density (P/Km²) |
|---|---|---|---|---|---|
| 2025 | 5,727,990 | 2.35 | 131,496 | 102.28 | 59.47 |
| 2024 | 5,596,494 | 2.37 | 129,473 | 102.22 | 58.10 |
| 2023 | 5,467,021 | 2.39 | 127,431 | 102.17 | 56.76 |
| 2022 | 5,339,590 | 2.40 | 125,386 | 102.11 | 55.44 |
| 2021 | 5,214,204 | 2.42 | 123,349 | 102.05 | 54.13 |
| 2020 | 5,090,855 | 2.45 | 121,788 | 101.98 | 52.85 |
| 2019 | 4,969,067 | 2.48 | 120,366 | 101.92 | 51.59 |
| 2018 | 4,848,701 | 2.50 | 118,264 | 101.85 | 50.34 |
| 2017 | 4,730,437 | 2.50 | 115,215 | 101.78 | 49.11 |
| 2016 | 4,615,222 | 2.48 | 111,784 | 101.70 | 47.92 |
| 2015 | 4,503,438 | 2.43 | 106,884 | 101.62 | 46.75 |
| 2014 | 4,396,554 | 2.40 | 102,862 | 101.53 | 45.65 |
| 2013 | 4,293,692 | 2.47 | 103,537 | 101.44 | 44.58 |
| 2012 | 4,190,155 | 2.71 | 110,581 | 101.35 | 43.50 |
| 2011 | 4,079,574 | 3.07 | 121,584 | 101.25 | 42.35 |
| 2010 | 3,957,990 | 3.57 | 136,492 | 101.15 | 41.09 |
| 2005 | 3,269,786 | 13.06 | 377,818 | 100.55 | 33.95 |
| 2000 | 2,891,968 | 39.04 | 812,047 | 99.88 | 30.02 |
| 1995 | 2,079,921 | -1.09 | -22,956 | 99.08 | 21.59 |
| 1990 | 2,102,877 | -4.30 | -94,565 | 99.12 | 21.83 |
| 1985 | 2,197,442 | 16.11 | 304,913 | 99.26 | 22.81 |
| 1980 | 1,892,529 | 16.20 | 263,873 | 99.35 | 19.65 |
| 1975 | 1,628,656 | 14.72 | 208,928 | 99.63 | 16.91 |
| 1970 | 1,419,728 | 13.31 | 166,760 | 100.17 | 14.74 |
| 1965 | 1,252,968 | 11.84 | 132,654 | 101.12 | 13.01 |
| 1960 | 1,120,314 | 10.92 | 110,250 | 102.88 | 11.63 |
| 1955 | 1,010,064 | 8.61 | 80,038 | 105.31 | 10.49 |
| 1950 | 930,026 | 108.46 | 9.66 |