Kiribati population
121,988
Births this year: 22,595
Births today 1
Deaths this year 7,532
Deaths today 0
121,988
| Region Name | Percents | Number |
|---|---|---|
| Roman Catholic | 55.8% | 59,664 people |
| Kempsville Presbyterian Church | 33.5% | 35,820 people |
| Mormon | 4.7% | 5,025 people |
| other | 6% | 6,416 people |
| Ethnic groups Name | Percents | Number |
|---|---|---|
| I-Kiribati | 89.5% | 95,698 people |
| I-Kiribati/mixed | 9.7% | 10,372 people |
| Tuvaluan | 0.1% | 107 people |
| other | 0.8% | 855 people |
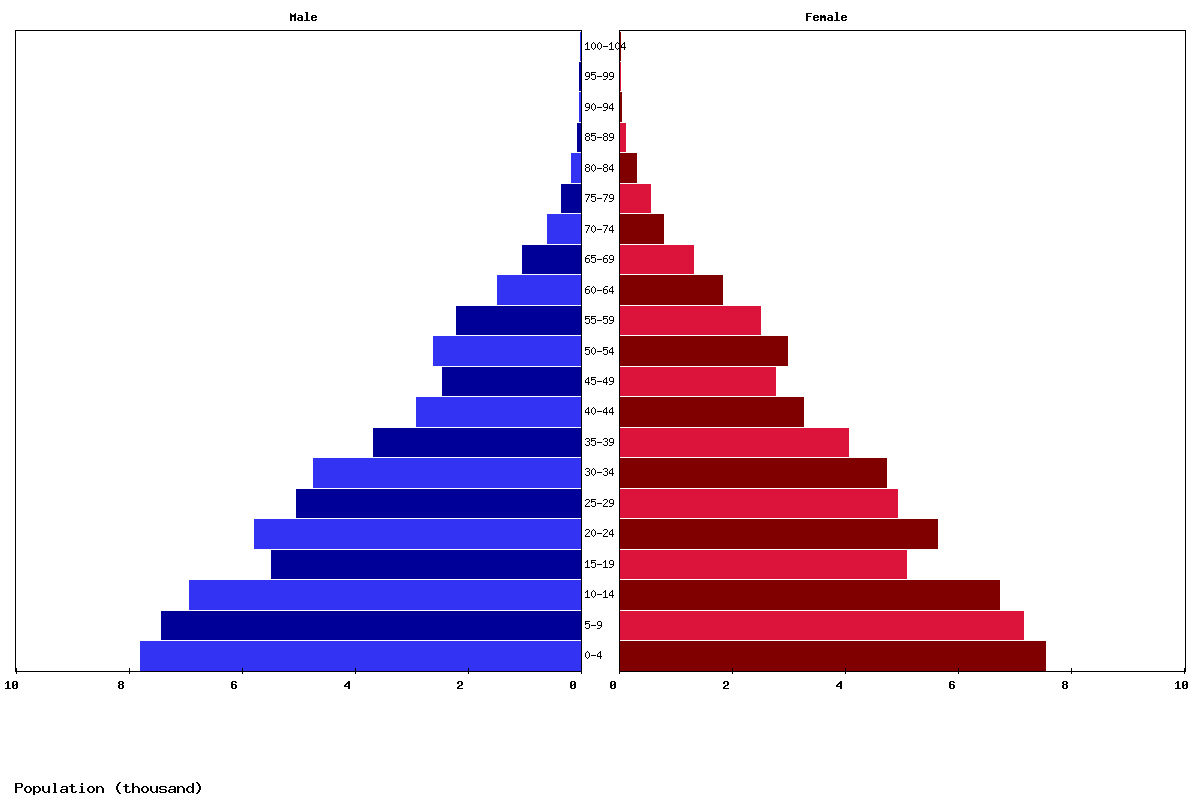
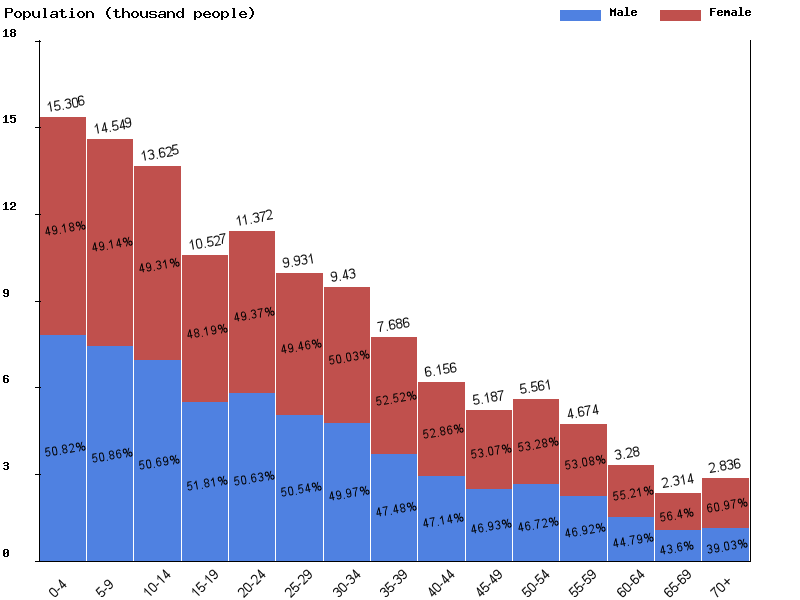
| Age | Both Sexes Population | Male Population | Female Population | Both Sexes (%) | Male (%) | Female (%) | Sex ratio (female/male) |
|---|---|---|---|---|---|---|---|
| Total | 132,283 | 65,210 | 67,073 | 100 | 100 | 100 | 97.2 |
| 00-04 | 15,507 | 7,847 | 7,660 | 11.7 | 12 | 11.4 | 102.4 |
| 05-09 | 15,113 | 7,655 | 7,458 | 11.4 | 11.7 | 11.1 | 102.6 |
| 10-14 | 14,452 | 7,340 | 7,112 | 10.9 | 11.3 | 10.6 | 103.2 |
| 15-19 | 13,341 | 6,745 | 6,596 | 10.1 | 10.3 | 9.8 | 102.3 |
| 20-24 | 10,050 | 5,187 | 4,863 | 7.6 | 8 | 7.3 | 106.7 |
| 25-29 | 10,887 | 5,485 | 5,402 | 8.2 | 8.4 | 8.1 | 101.5 |
| 30-34 | 9,542 | 4,801 | 4,741 | 7.2 | 7.4 | 7.1 | 101.3 |
| 35-39 | 9,117 | 4,535 | 4,582 | 6.9 | 7 | 6.8 | 99 |
| 40-44 | 7,428 | 3,506 | 3,922 | 5.6 | 5.4 | 5.8 | 89.4 |
| 45-49 | 5,927 | 2,772 | 3,155 | 4.5 | 4.3 | 4.7 | 87.9 |
| 50-54 | 4,953 | 2,299 | 2,654 | 3.7 | 3.5 | 4 | 86.6 |
| 55-59 | 5,240 | 2,410 | 2,830 | 4 | 3.7 | 4.2 | 85.2 |
| 60-64 | 4,285 | 1,966 | 2,319 | 3.2 | 3 | 3.5 | 84.8 |
| 65-69 | 2,873 | 1,245 | 1,628 | 2.2 | 1.9 | 2.4 | 76.5 |
| 70-74 | 1,877 | 784 | 1,093 | 1.4 | 1.2 | 1.6 | 71.7 |
| 75-79 | 964 | 393 | 571 | 0.7 | 0.6 | 0.9 | 68.8 |
| 80-84 | 493 | 172 | 321 | 0.4 | 0.3 | 0.5 | 53.6 |
| 85-89 | 189 | 57 | 132 | 0.1 | 0.1 | 0.2 | 43.2 |
| 90-94 | 40 | 10 | 30 | 0 | 0 | 0 | 33.3 |
| 95-99 | 5 | 1 | 4 | 0 | 0 | 0 | 25 |
| 100+ | 0 | 0 | 0 | 0 | 0 | 0 | 0 |
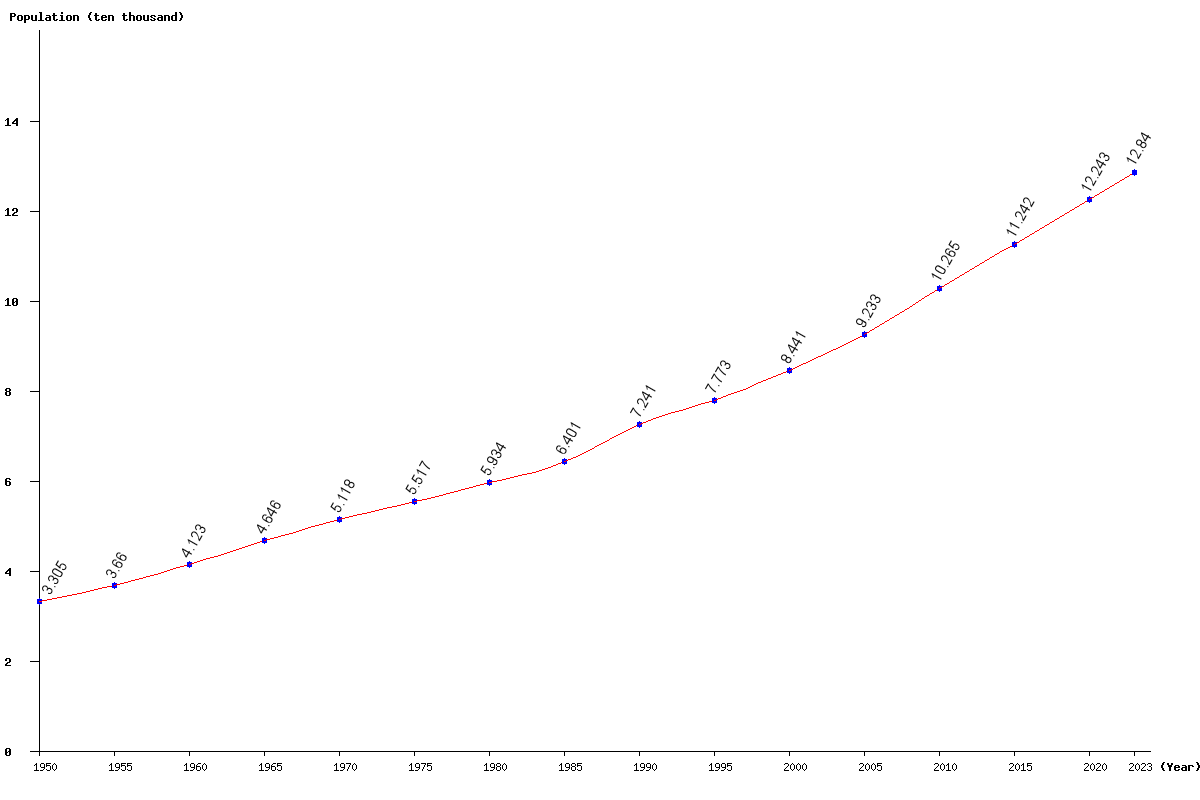
| Year | Population | Yearly % Change |
Yearly Change |
Sex ratio | Density (P/Km²) |
|---|---|---|---|---|---|
| 2025 | 132,283 | 1.48 | 1,932 | 97.22 | 163.31 |
| 2024 | 130,351 | 1.52 | 1,956 | 97.25 | 160.93 |
| 2023 | 128,395 | 1.56 | 1,975 | 97.28 | 158.51 |
| 2022 | 126,420 | 1.60 | 1,989 | 97.30 | 156.07 |
| 2021 | 124,431 | 1.63 | 1,997 | 97.32 | 153.62 |
| 2020 | 122,434 | 1.66 | 2,005 | 97.32 | 151.15 |
| 2019 | 120,429 | 1.70 | 2,012 | 97.32 | 148.68 |
| 2018 | 118,417 | 1.73 | 2,012 | 97.32 | 146.19 |
| 2017 | 116,405 | 1.75 | 2,000 | 97.30 | 143.71 |
| 2016 | 114,405 | 1.76 | 1,982 | 97.28 | 141.24 |
| 2015 | 112,423 | 1.77 | 1,953 | 97.24 | 138.79 |
| 2014 | 110,470 | 1.77 | 1,926 | 97.18 | 136.38 |
| 2013 | 108,544 | 1.80 | 1,924 | 97.12 | 134.00 |
| 2012 | 106,620 | 1.87 | 1,958 | 97.05 | 131.63 |
| 2011 | 104,662 | 1.96 | 2,014 | 96.99 | 129.21 |
| 2010 | 102,648 | 2.07 | 2,082 | 96.96 | 126.73 |
| 2005 | 92,329 | 9.39 | 7,923 | 97.13 | 113.99 |
| 2000 | 84,406 | 8.59 | 6,679 | 97.16 | 104.20 |
| 1995 | 77,727 | 7.34 | 5,316 | 98.27 | 95.96 |
| 1990 | 72,411 | 13.13 | 8,405 | 97.90 | 89.40 |
| 1985 | 64,006 | 7.86 | 4,666 | 98.06 | 79.02 |
| 1980 | 59,340 | 7.56 | 4,171 | 97.14 | 73.26 |
| 1975 | 55,169 | 7.79 | 3,988 | 97.63 | 68.11 |
| 1970 | 51,181 | 10.17 | 4,726 | 97.70 | 63.19 |
| 1965 | 46,455 | 12.66 | 5,221 | 97.61 | 57.35 |
| 1960 | 41,234 | 12.67 | 4,637 | 97.43 | 50.91 |
| 1955 | 36,597 | 10.73 | 3,547 | 97.22 | 45.18 |
| 1950 | 33,050 | 96.91 | 40.80 |