Kenya population
4,594,605
Births this year: 0
Births today 0
Deaths this year 84,470
Deaths today 11
4,594,605
| Region Name | Percents | Number |
|---|---|---|
| Christian (Protestant, Catholic, other) | 82.5% | 3,860,237 people |
| Muslim | 11.1% | 519,377 people |
| Traditionalists | 1.6% | 74,865 people |
| other | 1.7% | 79,544 people |
| none | 2.4% | 112,298 people |
| unspecified | 0.7% | 32,754 people |
| Ethnic groups Name | Percents | Number |
|---|---|---|
| Kikuyu | 22% | 1,029,397 people |
| Luhya | 14% | 655,071 people |
| Luo | 13% | 608,280 people |
| Kalenjin | 12% | 561,489 people |
| Kamba | 11% | 514,698 people |
| Kisii | 6% | 280,745 people |
| Meru | 6% | 280,745 people |
| other African | 15% | 701,861 people |
| non-African (Asian, European, and Arab) | 1% | 46,791 people |
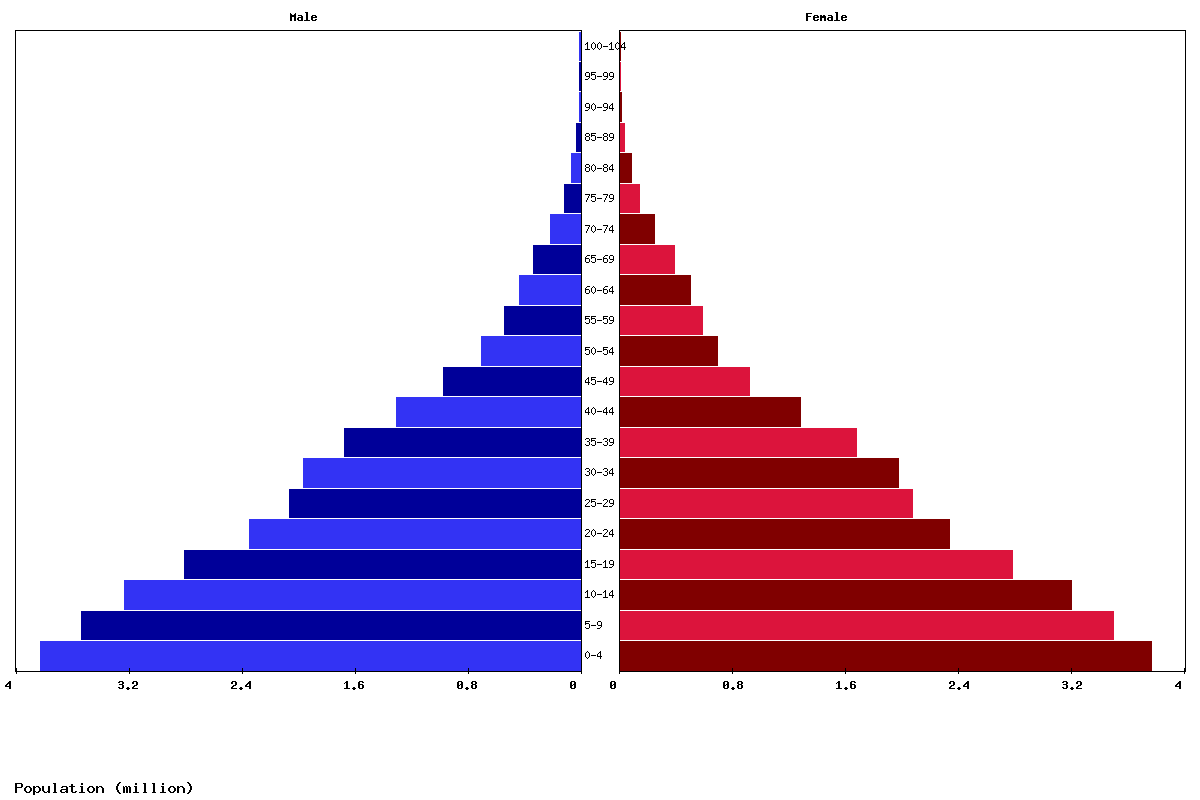
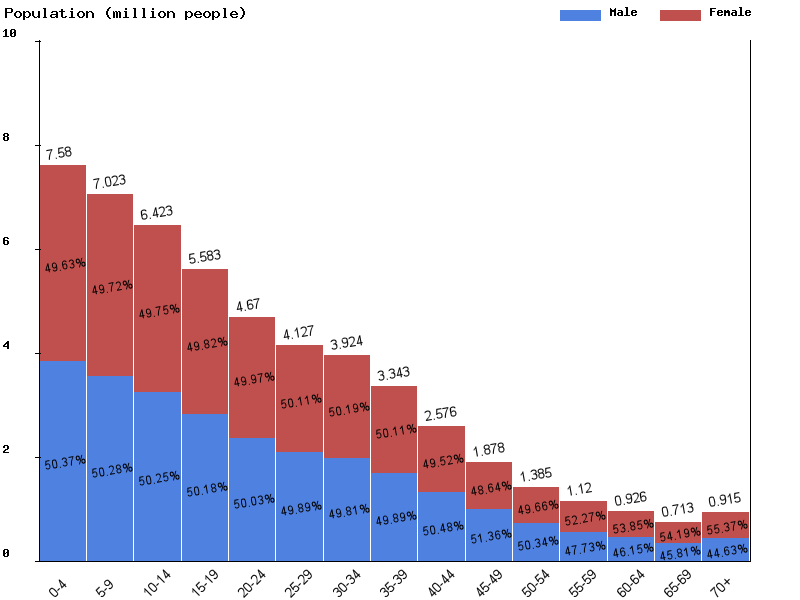
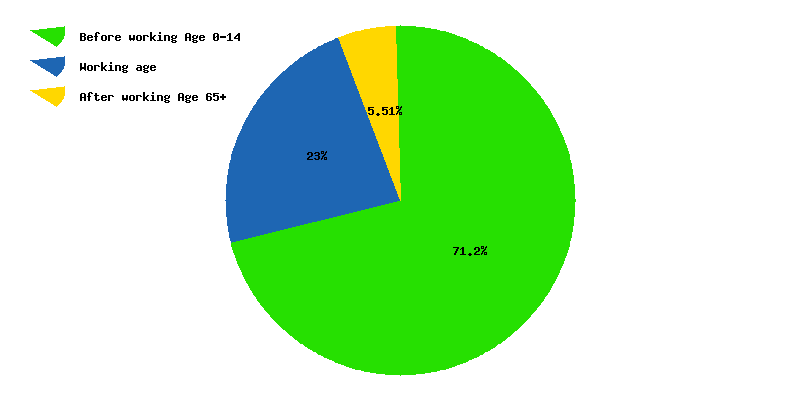
| Age | Both Sexes Population | Male Population | Female Population | Both Sexes (%) | Male (%) | Female (%) | Sex ratio (female/male) |
|---|---|---|---|---|---|---|---|
| Total | 58,610,170 | 29,231,124 | 29,379,046 | 100 | 100 | 100 | 99.5 |
| 00-04 | 8,005,364 | 4,032,159 | 3,973,205 | 13.7 | 13.8 | 13.5 | 101.5 |
| 05-09 | 7,452,513 | 3,742,937 | 3,709,576 | 12.7 | 12.8 | 12.6 | 100.9 |
| 10-14 | 6,967,891 | 3,498,586 | 3,469,305 | 11.9 | 12 | 11.8 | 100.8 |
| 15-19 | 6,364,998 | 3,193,186 | 3,171,812 | 10.9 | 10.9 | 10.8 | 100.7 |
| 20-24 | 5,501,686 | 2,752,433 | 2,749,253 | 9.4 | 9.4 | 9.4 | 100.1 |
| 25-29 | 4,577,522 | 2,284,114 | 2,293,408 | 7.8 | 7.8 | 7.8 | 99.6 |
| 30-34 | 4,031,560 | 2,006,834 | 2,024,726 | 6.9 | 6.9 | 6.9 | 99.1 |
| 35-39 | 3,820,083 | 1,897,267 | 1,922,816 | 6.5 | 6.5 | 6.5 | 98.7 |
| 40-44 | 3,243,165 | 1,612,338 | 1,630,827 | 5.5 | 5.5 | 5.6 | 98.9 |
| 45-49 | 2,486,196 | 1,250,129 | 1,236,067 | 4.2 | 4.3 | 4.2 | 101.1 |
| 50-54 | 1,796,683 | 917,680 | 879,003 | 3.1 | 3.1 | 3 | 104.4 |
| 55-59 | 1,311,215 | 654,453 | 656,762 | 2.2 | 2.2 | 2.2 | 99.6 |
| 60-64 | 1,041,534 | 490,926 | 550,608 | 1.8 | 1.7 | 1.9 | 89.2 |
| 65-69 | 829,488 | 376,288 | 453,200 | 1.4 | 1.3 | 1.5 | 83 |
| 70-74 | 598,824 | 268,750 | 330,074 | 1 | 0.9 | 1.1 | 81.4 |
| 75-79 | 341,143 | 151,946 | 189,197 | 0.6 | 0.5 | 0.6 | 80.3 |
| 80-84 | 152,943 | 66,018 | 86,925 | 0.3 | 0.2 | 0.3 | 75.9 |
| 85-89 | 65,494 | 26,814 | 38,680 | 0.1 | 0.1 | 0.1 | 69.3 |
| 90-94 | 18,842 | 7,235 | 11,607 | 0 | 0 | 0 | 62.3 |
| 95-99 | 2,799 | 964 | 1,835 | 0 | 0 | 0 | 52.5 |
| 100+ | 227 | 67 | 160 | 0 | 0 | 0 | 41.9 |
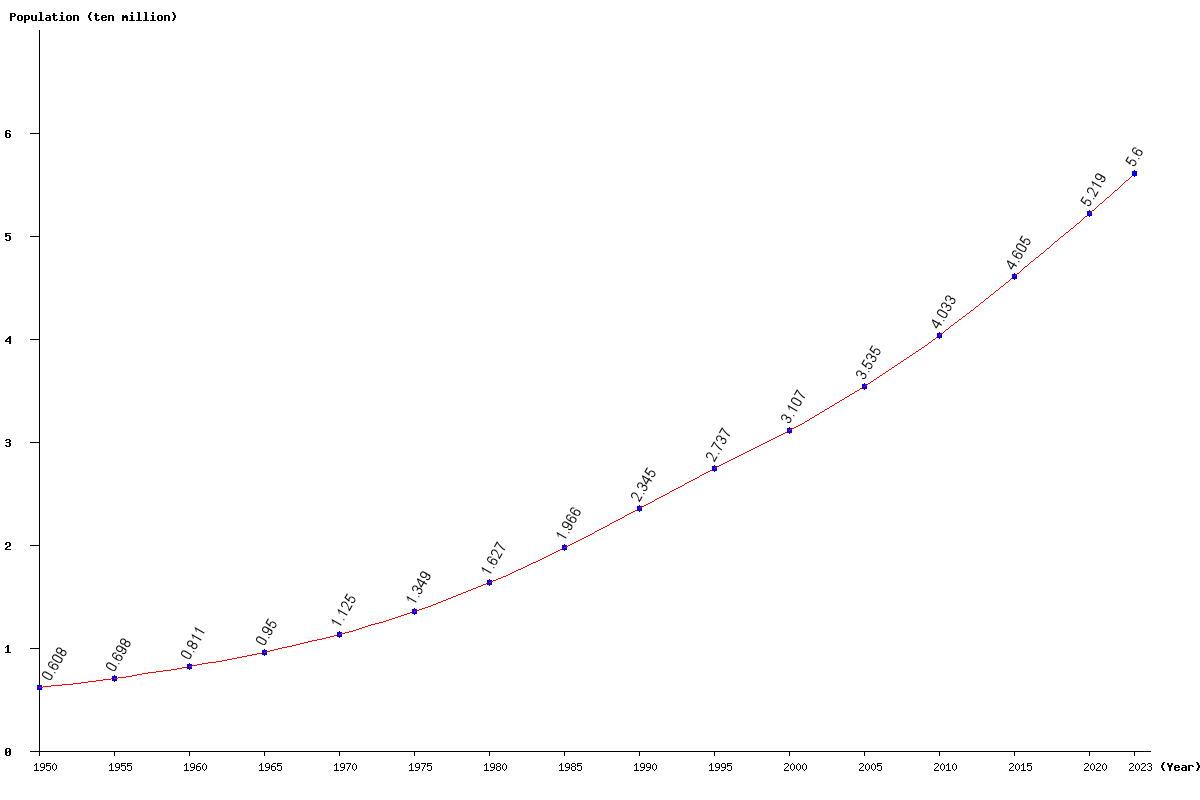
| Year | Population | Yearly % Change |
Yearly Change |
Sex ratio | Density (P/Km²) |
|---|---|---|---|---|---|
| 2025 | 58,610,170 | 2.29 | 1,312,419 | 99.50 | 102.98 |
| 2024 | 57,297,751 | 2.32 | 1,296,486 | 99.54 | 100.67 |
| 2023 | 56,001,265 | 2.34 | 1,282,449 | 99.58 | 98.40 |
| 2022 | 54,718,816 | 2.38 | 1,270,955 | 99.62 | 96.14 |
| 2021 | 53,447,861 | 2.42 | 1,261,139 | 99.66 | 93.91 |
| 2020 | 52,186,722 | 2.46 | 1,251,223 | 99.70 | 91.69 |
| 2019 | 50,935,499 | 2.50 | 1,240,180 | 99.75 | 89.50 |
| 2018 | 49,695,319 | 2.53 | 1,228,391 | 99.80 | 87.32 |
| 2017 | 48,466,928 | 2.57 | 1,215,479 | 99.85 | 85.16 |
| 2016 | 47,251,449 | 2.61 | 1,201,147 | 99.90 | 83.02 |
| 2015 | 46,050,302 | 2.65 | 1,186,719 | 99.93 | 80.91 |
| 2014 | 44,863,583 | 2.68 | 1,170,702 | 99.95 | 78.83 |
| 2013 | 43,692,881 | 2.70 | 1,149,903 | 99.96 | 76.77 |
| 2012 | 42,542,978 | 2.71 | 1,123,024 | 99.96 | 74.75 |
| 2011 | 41,419,954 | 2.71 | 1,091,641 | 99.95 | 72.78 |
| 2010 | 40,328,313 | 2.69 | 1,058,325 | 99.95 | 70.86 |
| 2005 | 35,349,040 | 13.79 | 4,283,220 | 99.89 | 62.11 |
| 2000 | 31,065,820 | 13.49 | 3,692,785 | 99.42 | 54.58 |
| 1995 | 27,373,035 | 16.75 | 3,926,806 | 99.22 | 48.10 |
| 1990 | 23,446,229 | 19.25 | 3,785,516 | 99.24 | 41.20 |
| 1985 | 19,660,713 | 20.86 | 3,392,807 | 99.24 | 34.54 |
| 1980 | 16,267,906 | 20.63 | 2,781,665 | 99.19 | 28.58 |
| 1975 | 13,486,241 | 19.85 | 2,233,775 | 99.26 | 23.70 |
| 1970 | 11,252,466 | 18.39 | 1,747,764 | 99.53 | 19.77 |
| 1965 | 9,504,702 | 17.26 | 1,399,262 | 99.97 | 16.70 |
| 1960 | 8,105,440 | 16.12 | 1,125,501 | 100.61 | 14.24 |
| 1955 | 6,979,939 | 14.86 | 903,182 | 101.10 | 12.26 |
| 1950 | 6,076,757 | 101.74 | 10.68 |