Jordan population
995,439
Births this year: 207,879
Births today 10
Deaths this year 30,978
Deaths today 1
995,439
| Region Name | Percents | Number |
|---|---|---|
| Muslim (official, predominantly Sunni) | 97.2% | 795,619 people |
| Christian (majority Greek Orthodox, but some Greek and Roman Catholics, Syrian Orthodox, Coptic Orthodox, Armenian Orthodox, and Protestant denominations) | 2.2% | 18,008 people |
| Buddhist | 0.4% | 3,274 people |
| Hindu | 0.1% | 819 people |
| Jewish <.1 | 0.1% | 819 people |
| folk religion <.1 | 0.1% | 819 people |
| unaffiliated <.1 | 0.1% | 819 people |
| other <.1 | 0.1% | 819 people |
| Ethnic groups Name | Percents | Number |
|---|---|---|
| Arab | 98% | 802,167 people |
| Circassian | 1% | 8,185 people |
| Armenian | 1% | 8,185 people |
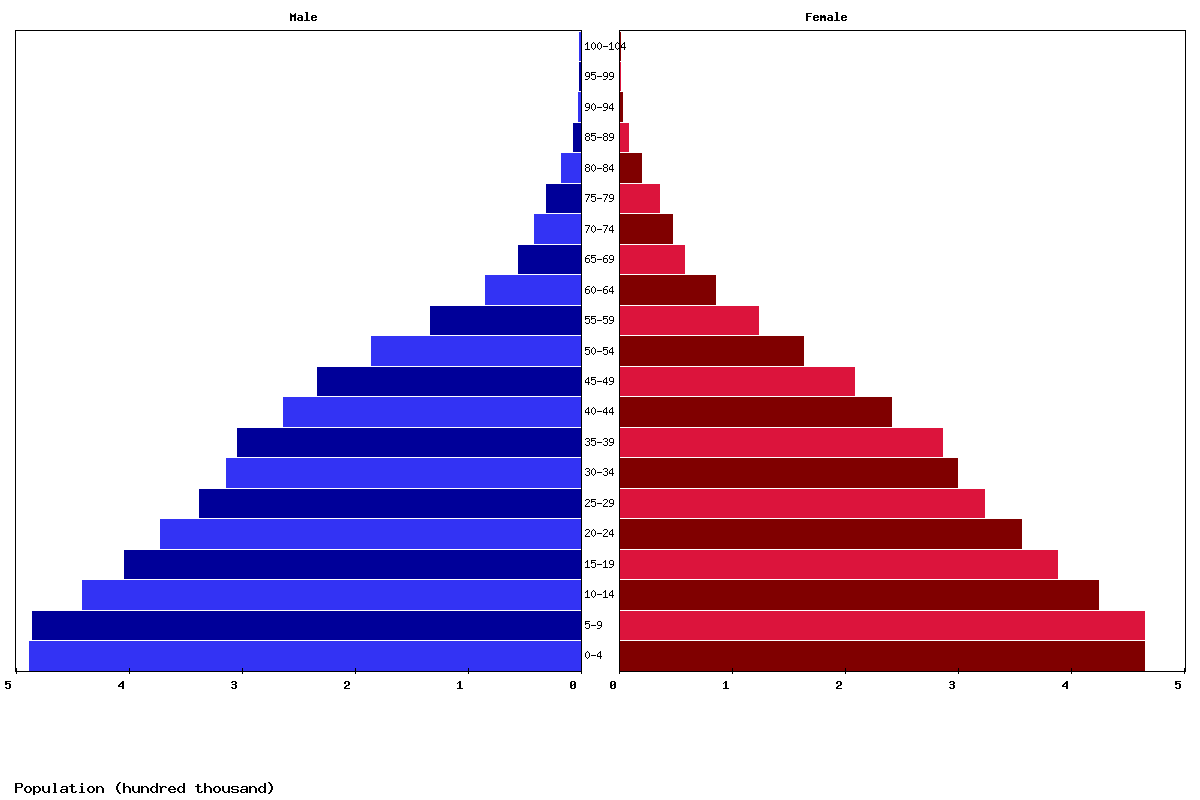
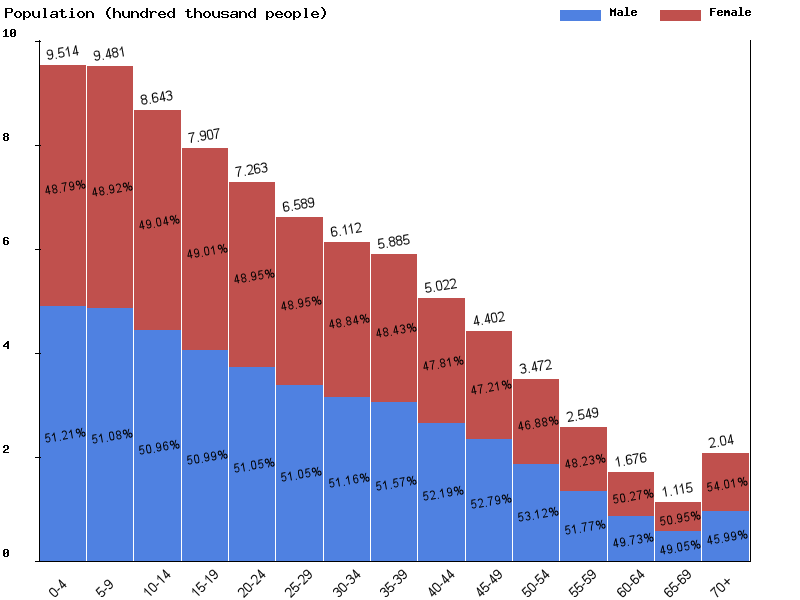
| Age | Both Sexes Population | Male Population | Female Population | Both Sexes (%) | Male (%) | Female (%) | Sex ratio (female/male) |
|---|---|---|---|---|---|---|---|
| Total | 8,547,226 | 4,379,447 | 4,167,779 | 100 | 100 | 100 | 105.1 |
| 00-04 | 904,590 | 463,320 | 441,270 | 10.6 | 10.6 | 10.6 | 105 |
| 05-09 | 909,722 | 465,692 | 444,030 | 10.6 | 10.6 | 10.7 | 104.9 |
| 10-14 | 906,074 | 463,206 | 442,868 | 10.6 | 10.6 | 10.6 | 104.6 |
| 15-19 | 820,674 | 419,257 | 401,417 | 9.6 | 9.6 | 9.6 | 104.4 |
| 20-24 | 748,112 | 382,275 | 365,837 | 8.8 | 8.7 | 8.8 | 104.5 |
| 25-29 | 685,909 | 350,996 | 334,913 | 8 | 8 | 8 | 104.8 |
| 30-34 | 620,540 | 317,749 | 302,791 | 7.3 | 7.3 | 7.3 | 104.9 |
| 35-39 | 577,300 | 296,329 | 280,971 | 6.8 | 6.8 | 6.7 | 105.5 |
| 40-44 | 559,934 | 289,621 | 270,313 | 6.6 | 6.6 | 6.5 | 107.1 |
| 45-49 | 477,194 | 249,639 | 227,555 | 5.6 | 5.7 | 5.5 | 109.7 |
| 50-54 | 415,755 | 219,700 | 196,055 | 4.9 | 5 | 4.7 | 112.1 |
| 55-59 | 323,312 | 171,398 | 151,914 | 3.8 | 3.9 | 3.6 | 112.8 |
| 60-64 | 232,015 | 119,119 | 112,896 | 2.7 | 2.7 | 2.7 | 105.5 |
| 65-69 | 146,881 | 71,751 | 75,130 | 1.7 | 1.6 | 1.8 | 95.5 |
| 70-74 | 91,768 | 43,787 | 47,981 | 1.1 | 1 | 1.2 | 91.3 |
| 75-79 | 64,864 | 29,038 | 35,826 | 0.8 | 0.7 | 0.9 | 81.1 |
| 80-84 | 40,160 | 17,296 | 22,864 | 0.5 | 0.4 | 0.5 | 75.6 |
| 85-89 | 17,179 | 7,352 | 9,827 | 0.2 | 0.2 | 0.2 | 74.8 |
| 90-94 | 4,558 | 1,713 | 2,845 | 0.1 | 0 | 0.1 | 60.2 |
| 95-99 | 637 | 197 | 440 | 0 | 0 | 0 | 44.8 |
| 100+ | 48 | 12 | 36 | 0 | 0 | 0 | 33.3 |
| Year | Population | Yearly % Change |
Yearly Change |
Sex ratio | Density (P/Km²) |
|---|---|---|---|---|---|
| 2025 | 8,547,226 | 0.99 | 83,370 | 105.08 | 96.27 |
| 2024 | 8,463,856 | 0.89 | 74,856 | 105.06 | 95.34 |
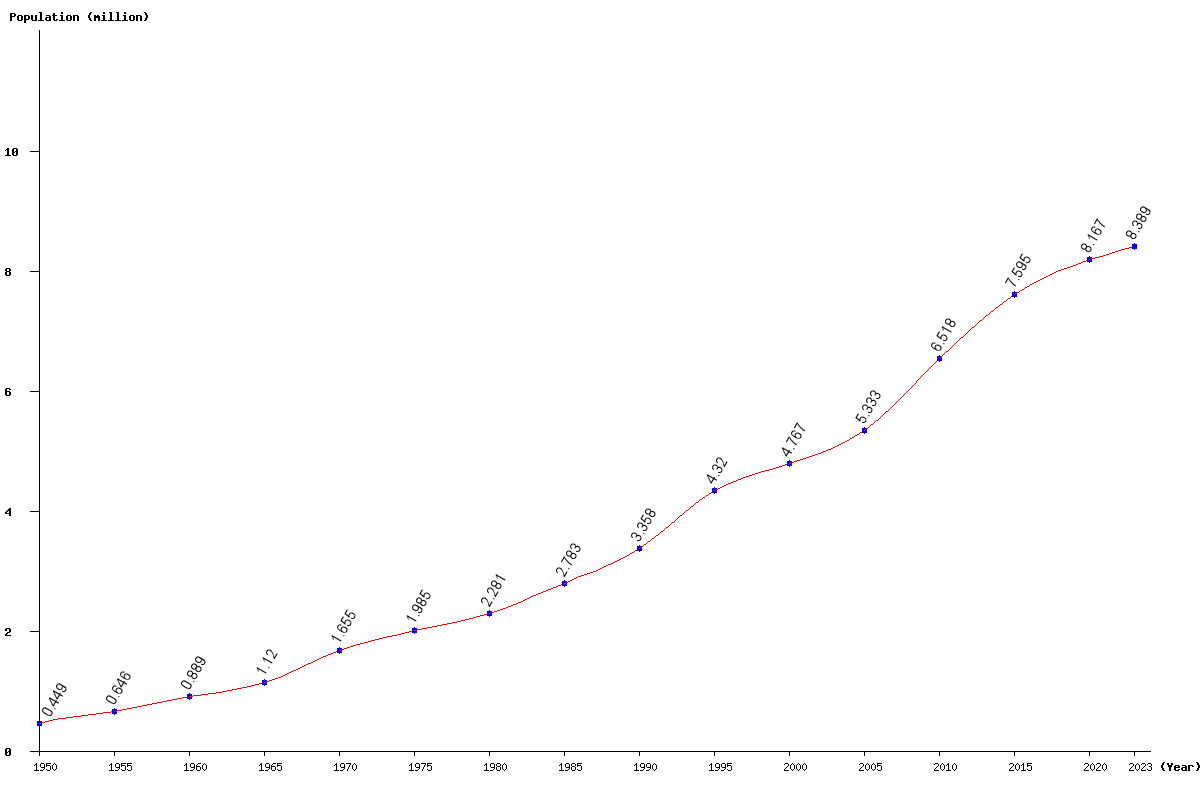
| 2023 | 8,389,000 | 0.85 | 70,713 | 105.03 | 94.49 |
| 2022 | 8,318,287 | 0.88 | 72,422 | 104.99 | 93.70 |
| 2021 | 8,245,865 | 0.97 | 79,073 | 104.94 | 92.88 |
| 2020 | 8,166,792 | 1.07 | 86,480 | 104.90 | 91.99 |
| 2019 | 8,080,312 | 1.19 | 94,901 | 104.86 | 91.02 |
| 2018 | 7,985,411 | 1.38 | 108,708 | 104.82 | 89.95 |
| 2017 | 7,876,703 | 1.66 | 128,903 | 104.81 | 88.72 |
| 2016 | 7,747,800 | 2.02 | 153,253 | 104.85 | 87.27 |
| 2015 | 7,594,547 | 2.41 | 178,464 | 104.95 | 85.54 |
| 2014 | 7,416,083 | 2.79 | 201,251 | 105.14 | 83.53 |
| 2013 | 7,214,832 | 3.15 | 220,381 | 105.41 | 81.27 |
| 2012 | 6,994,451 | 3.46 | 234,080 | 105.73 | 78.78 |
| 2011 | 6,760,371 | 3.72 | 242,459 | 106.07 | 76.15 |
| 2010 | 6,517,912 | 4.01 | 251,047 | 106.38 | 73.42 |
| 2005 | 5,332,982 | 11.86 | 565,506 | 107.50 | 60.07 |
| 2000 | 4,767,476 | 10.35 | 447,318 | 108.71 | 53.70 |
| 1995 | 4,320,158 | 28.64 | 961,705 | 110.68 | 48.66 |
| 1990 | 3,358,453 | 20.68 | 575,568 | 110.68 | 37.83 |
| 1985 | 2,782,885 | 22.02 | 502,215 | 111.40 | 31.35 |
| 1980 | 2,280,670 | 14.89 | 295,549 | 109.58 | 25.69 |
| 1975 | 1,985,121 | 19.96 | 330,352 | 107.09 | 22.36 |
| 1970 | 1,654,769 | 47.77 | 534,971 | 107.78 | 18.64 |
| 1965 | 1,119,798 | 26.01 | 231,166 | 108.96 | 12.61 |
| 1960 | 888,632 | 37.62 | 242,908 | 109.63 | 10.01 |
| 1955 | 645,724 | 43.86 | 196,863 | 109.10 | 7.27 |
| 1950 | 448,861 | 107.87 | 5.06 |