Ireland population
5,342,228
Births this year: 706,432
Births today 128
Deaths this year 316,676
Deaths today 57
5,342,228
| Region Name | Percents | Number |
|---|---|---|
| Roman Catholic | 84.7% | 4,194,745 people |
| Church of Ireland | 2.7% | 133,717 people |
| other Christian | 2.7% | 133,717 people |
| Muslim | 1.1% | 54,477 people |
| other | 1.7% | 84,192 people |
| unspecified | 1.5% | 74,287 people |
| none | 5.7% | 282,291 people |
| Ethnic groups Name | Percents | Number |
|---|---|---|
| Irish | 84.5% | 4,184,840 people |
| other white | 9.8% | 485,342 people |
| Asian | 1.9% | 94,097 people |
| black | 1.4% | 69,335 people |
| mixed and other | 0.9% | 44,572 people |
| unspecified | 1.6% | 79,240 people |
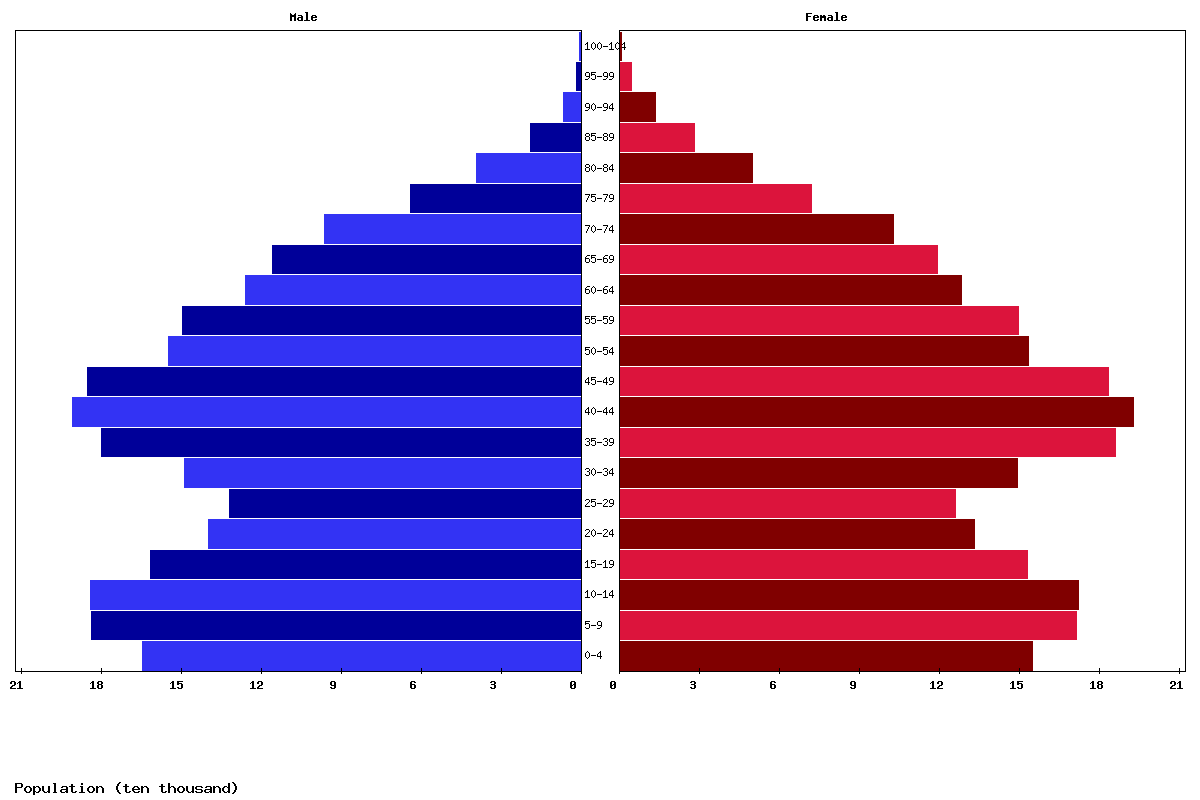
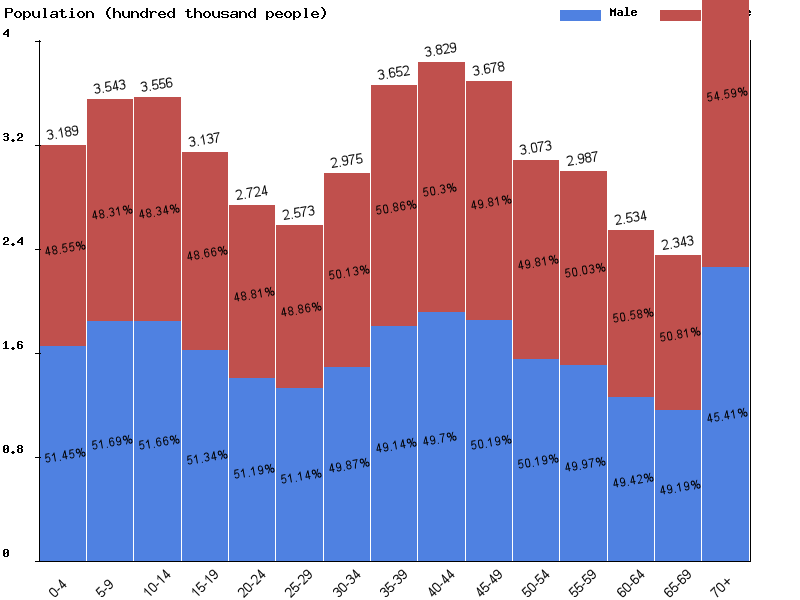
| Age | Both Sexes Population | Male Population | Female Population | Both Sexes (%) | Male (%) | Female (%) | Sex ratio (female/male) |
|---|---|---|---|---|---|---|---|
| Total | 5,048,457 | 2,521,816 | 2,526,641 | 100 | 100 | 100 | 99.8 |
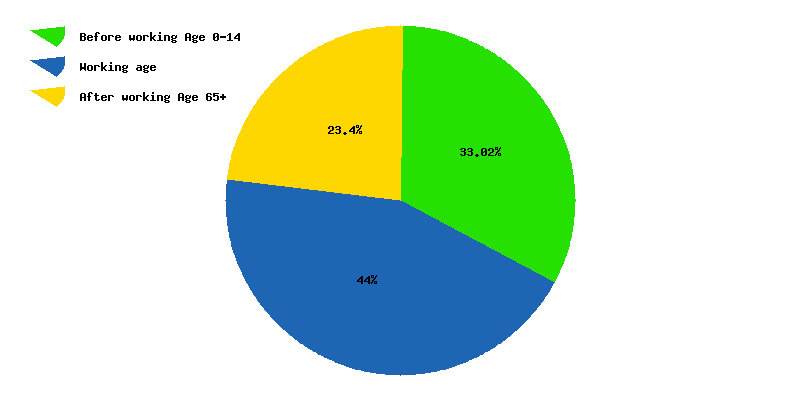
| 00-04 | 293,652 | 150,388 | 143,264 | 5.8 | 6 | 5.7 | 105 |
| 05-09 | 320,940 | 165,087 | 155,853 | 6.4 | 6.5 | 6.2 | 105.9 |
| 10-14 | 355,417 | 183,695 | 171,722 | 7 | 7.3 | 6.8 | 107 |
| 15-19 | 358,555 | 185,046 | 173,509 | 7.1 | 7.3 | 6.9 | 106.6 |
| 20-24 | 320,635 | 164,210 | 156,425 | 6.4 | 6.5 | 6.2 | 105 |
| 25-29 | 281,226 | 143,577 | 137,649 | 5.6 | 5.7 | 5.4 | 104.3 |
| 30-34 | 264,663 | 135,119 | 129,544 | 5.2 | 5.4 | 5.1 | 104.3 |
| 35-39 | 302,398 | 150,734 | 151,664 | 6 | 6 | 6 | 99.4 |
| 40-44 | 367,614 | 180,579 | 187,035 | 7.3 | 7.2 | 7.4 | 96.5 |
| 45-49 | 383,025 | 190,230 | 192,795 | 7.6 | 7.5 | 7.6 | 98.7 |
| 50-54 | 365,742 | 183,397 | 182,345 | 7.2 | 7.3 | 7.2 | 100.6 |
| 55-59 | 303,644 | 152,100 | 151,544 | 6 | 6 | 6 | 100.4 |
| 60-64 | 292,123 | 145,405 | 146,718 | 5.8 | 5.8 | 5.8 | 99.1 |
| 65-69 | 244,038 | 119,641 | 124,397 | 4.8 | 4.7 | 4.9 | 96.2 |
| 70-74 | 219,455 | 106,303 | 113,152 | 4.3 | 4.2 | 4.5 | 93.9 |
| 75-79 | 176,128 | 83,048 | 93,080 | 3.5 | 3.3 | 3.7 | 89.2 |
| 80-84 | 108,097 | 48,411 | 59,686 | 2.1 | 1.9 | 2.4 | 81.1 |
| 85-89 | 59,393 | 24,126 | 35,267 | 1.2 | 1 | 1.4 | 68.4 |
| 90-94 | 24,049 | 8,702 | 15,347 | 0.5 | 0.3 | 0.6 | 56.7 |
| 95-99 | 6,517 | 1,785 | 4,732 | 0.1 | 0.1 | 0.2 | 37.7 |
| 100+ | 1,146 | 233 | 913 | 0 | 0 | 0 | 25.5 |
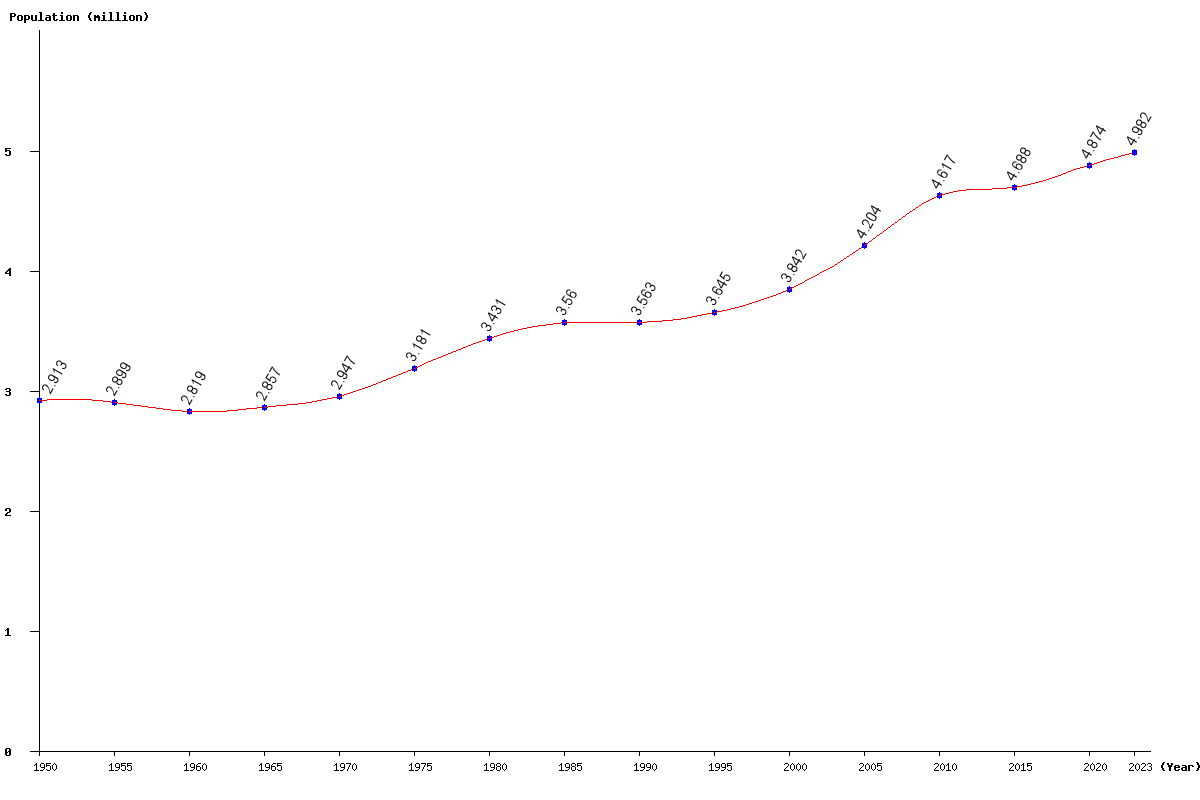
| Year | Population | Yearly % Change |
Yearly Change |
Sex ratio | Density (P/Km²) |
|---|---|---|---|---|---|
| 2025 | 5,048,457 | 0.66 | 32,941 | 99.81 | 73.28 |
| 2024 | 5,015,516 | 0.67 | 33,488 | 99.81 | 72.80 |
| 2023 | 4,982,028 | 0.70 | 34,421 | 99.80 | 72.32 |
| 2022 | 4,947,607 | 0.73 | 35,860 | 99.80 | 71.82 |
| 2021 | 4,911,747 | 0.77 | 37,455 | 99.80 | 71.30 |
| 2020 | 4,874,292 | 0.84 | 40,454 | 99.79 | 70.75 |
| 2019 | 4,833,838 | 0.90 | 42,993 | 99.77 | 70.17 |
| 2018 | 4,790,845 | 0.88 | 41,692 | 99.76 | 69.54 |
| 2017 | 4,749,153 | 0.75 | 35,160 | 99.73 | 68.94 |
| 2016 | 4,713,993 | 0.54 | 25,528 | 99.70 | 68.43 |
| 2015 | 4,688,465 | 0.28 | 13,301 | 99.65 | 68.06 |
| 2014 | 4,675,164 | 0.08 | 3,901 | 99.57 | 67.86 |
| 2013 | 4,671,263 | 0.07 | 3,395 | 99.48 | 67.81 |
| 2012 | 4,667,868 | 0.33 | 15,154 | 99.39 | 67.76 |
| 2011 | 4,652,714 | 0.77 | 35,380 | 99.34 | 67.54 |
| 2010 | 4,617,334 | 1.29 | 58,731 | 99.33 | 67.02 |
| 2005 | 4,203,700 | 9.43 | 362,126 | 99.77 | 61.02 |
| 2000 | 3,841,574 | 5.38 | 196,241 | 98.93 | 55.76 |
| 1995 | 3,645,333 | 2.31 | 82,227 | 98.73 | 52.92 |
| 1990 | 3,563,106 | 0.08 | 2,881 | 99.15 | 51.72 |
| 1985 | 3,560,225 | 3.76 | 129,147 | 100.11 | 51.68 |
| 1980 | 3,431,078 | 7.87 | 250,273 | 100.95 | 49.81 |
| 1975 | 3,180,805 | 7.92 | 233,466 | 100.98 | 46.17 |
| 1970 | 2,947,339 | 3.16 | 90,235 | 100.84 | 42.78 |
| 1965 | 2,857,104 | 1.35 | 38,045 | 100.95 | 41.47 |
| 1960 | 2,819,059 | -2.76 | -79,996 | 101.22 | 40.92 |
| 1955 | 2,899,055 | -0.48 | -14,038 | 102.57 | 42.08 |
| 1950 | 2,913,093 | 103.56 | 42.29 |