Iceland population
361,106
Births this year: 46,420
Births today 5
Deaths this year 21,192
Deaths today 2
361,106
| Region Name | Percents | Number |
|---|---|---|
| Evangelical Lutheran Church of Iceland (official) | 76.2% | 255,939 people |
| Roman Catholic | 3.4% | 11,420 people |
| Reykjavik Free Church | 2.9% | 9,740 people |
| Hafnarfjorour Free Church | 1.9% | 6,382 people |
| The Independent Congregation | 1% | 3,359 people |
| other religions (includes Pentecostal and Asatru Association) | 3.6% | 12,092 people |
| none | 5.2% | 17,466 people |
| other or unspecified | 5.9% | 19,817 people |
| Ethnic groups Name | Percents | Number |
|---|---|---|
| homogeneous mixture of descendants of Norse and Celts | 94% | 315,725 people |
| population of foreign origin | 6% | 20,153 people |
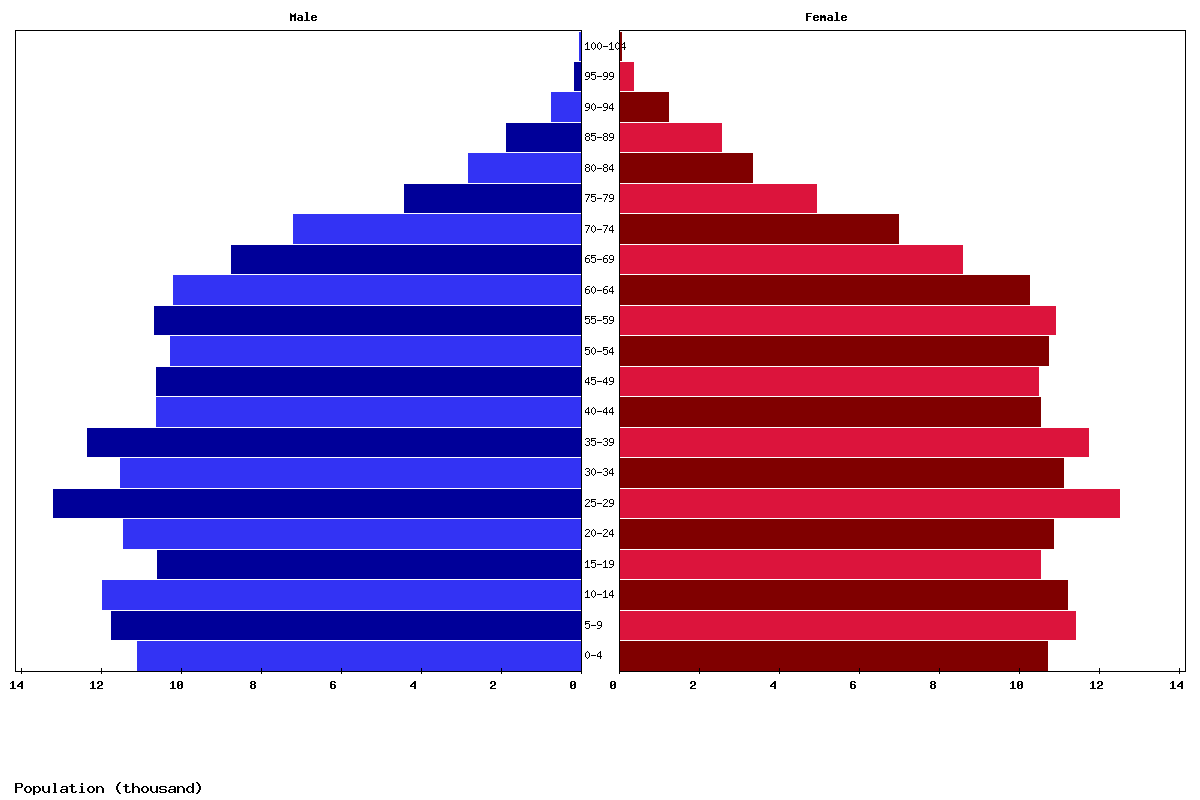
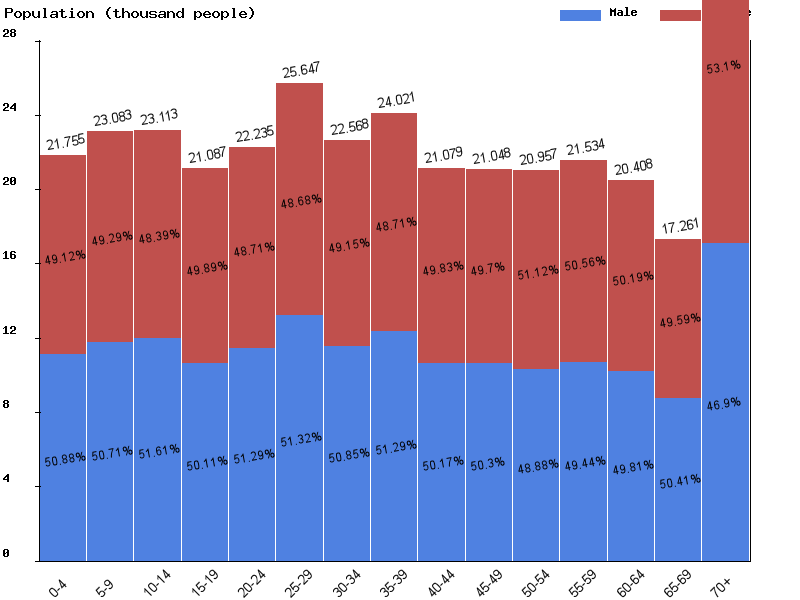
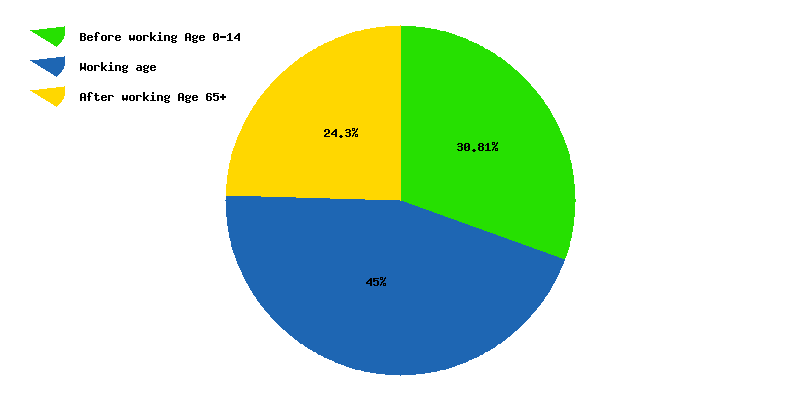
| Age | Both Sexes Population | Male Population | Female Population | Both Sexes (%) | Male (%) | Female (%) | Sex ratio (female/male) |
|---|---|---|---|---|---|---|---|
| Total | 354,026 | 177,744 | 176,282 | 100 | 100 | 100 | 100.8 |
| 00-04 | 21,573 | 10,977 | 10,596 | 6.1 | 6.2 | 6 | 103.6 |
| 05-09 | 21,830 | 11,099 | 10,731 | 6.2 | 6.2 | 6.1 | 103.4 |
| 10-14 | 23,183 | 11,747 | 11,436 | 6.5 | 6.6 | 6.5 | 102.7 |
| 15-19 | 23,288 | 12,004 | 11,284 | 6.6 | 6.8 | 6.4 | 106.4 |
| 20-24 | 21,326 | 10,676 | 10,650 | 6 | 6 | 6 | 100.2 |
| 25-29 | 22,490 | 11,536 | 10,954 | 6.4 | 6.5 | 6.2 | 105.3 |
| 30-34 | 25,826 | 13,260 | 12,566 | 7.3 | 7.5 | 7.1 | 105.5 |
| 35-39 | 22,687 | 11,540 | 11,147 | 6.4 | 6.5 | 6.3 | 103.5 |
| 40-44 | 24,091 | 12,356 | 11,735 | 6.8 | 7 | 6.7 | 105.3 |
| 45-49 | 21,098 | 10,580 | 10,518 | 6 | 6 | 6 | 100.6 |
| 50-54 | 20,985 | 10,539 | 10,446 | 5.9 | 5.9 | 5.9 | 100.9 |
| 55-59 | 20,770 | 10,131 | 10,639 | 5.9 | 5.7 | 6 | 95.2 |
| 60-64 | 21,138 | 10,432 | 10,706 | 6 | 5.9 | 6.1 | 97.4 |
| 65-69 | 19,719 | 9,787 | 9,932 | 5.6 | 5.5 | 5.6 | 98.5 |
| 70-74 | 16,318 | 8,173 | 8,145 | 4.6 | 4.6 | 4.6 | 100.3 |
| 75-79 | 12,808 | 6,428 | 6,380 | 3.6 | 3.6 | 3.6 | 100.8 |
| 80-84 | 7,699 | 3,535 | 4,164 | 2.2 | 2 | 2.4 | 84.9 |
| 85-89 | 4,289 | 1,873 | 2,416 | 1.2 | 1.1 | 1.4 | 77.5 |
| 90-94 | 2,231 | 862 | 1,369 | 0.6 | 0.5 | 0.8 | 63 |
| 95-99 | 601 | 191 | 410 | 0.2 | 0.1 | 0.2 | 46.6 |
| 100+ | 76 | 18 | 58 | 0 | 0 | 0 | 31 |
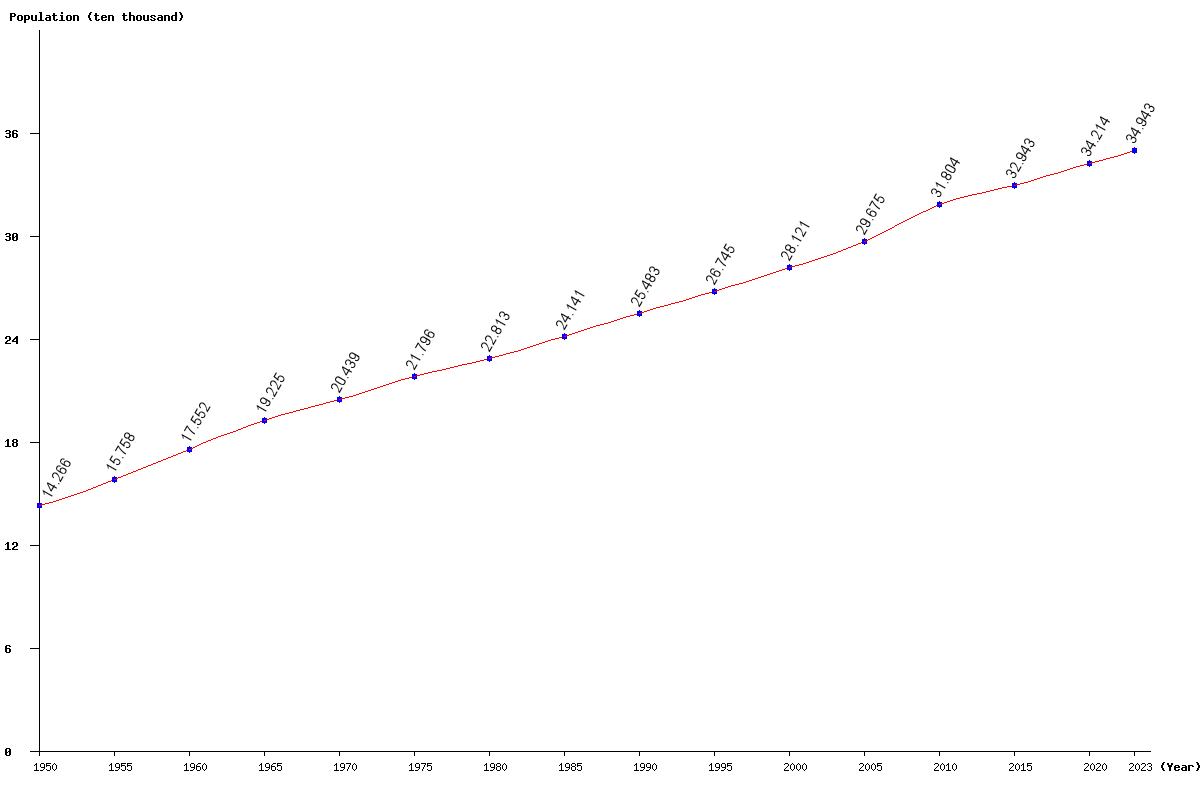
| Year | Population | Yearly % Change |
Yearly Change |
Sex ratio | Density (P/Km²) |
|---|---|---|---|---|---|
| 2025 | 354,026 | 0.65 | 2,275 | 100.83 | 3.53 |
| 2024 | 351,751 | 0.67 | 2,324 | 100.80 | 3.51 |
| 2023 | 349,427 | 0.68 | 2,375 | 100.76 | 3.49 |
| 2022 | 347,052 | 0.70 | 2,429 | 100.73 | 3.46 |
| 2021 | 344,623 | 0.73 | 2,482 | 100.68 | 3.44 |
| 2020 | 342,141 | 0.76 | 2,565 | 100.62 | 3.41 |
| 2019 | 339,576 | 0.78 | 2,638 | 100.54 | 3.39 |
| 2018 | 336,938 | 0.79 | 2,635 | 100.45 | 3.36 |
| 2017 | 334,303 | 0.76 | 2,525 | 100.37 | 3.33 |
| 2016 | 331,778 | 0.71 | 2,353 | 100.34 | 3.31 |
| 2015 | 329,425 | 0.64 | 2,107 | 100.37 | 3.29 |
| 2014 | 327,318 | 0.59 | 1,926 | 100.49 | 3.27 |
| 2013 | 325,392 | 0.61 | 1,985 | 100.67 | 3.25 |
| 2012 | 323,407 | 0.74 | 2,377 | 100.88 | 3.23 |
| 2011 | 321,030 | 0.94 | 2,988 | 101.08 | 3.20 |
| 2010 | 318,042 | 1.18 | 3,706 | 101.22 | 3.17 |
| 2005 | 296,745 | 5.52 | 15,531 | 101.12 | 2.96 |
| 2000 | 281,214 | 5.14 | 13,760 | 100.25 | 2.81 |
| 1995 | 267,454 | 4.95 | 12,624 | 100.57 | 2.67 |
| 1990 | 254,830 | 5.56 | 13,419 | 100.83 | 2.54 |
| 1985 | 241,411 | 5.82 | 13,284 | 101.14 | 2.41 |
| 1980 | 228,127 | 4.67 | 10,169 | 101.67 | 2.28 |
| 1975 | 217,958 | 6.64 | 13,566 | 102.15 | 2.17 |
| 1970 | 204,392 | 6.32 | 12,141 | 102.30 | 2.04 |
| 1965 | 192,251 | 9.53 | 16,731 | 102.21 | 1.92 |
| 1960 | 175,520 | 11.38 | 17,936 | 102.08 | 1.75 |
| 1955 | 157,584 | 10.46 | 14,928 | 101.44 | 1.57 |
| 1950 | 142,656 | 100.03 | 1.42 |