Guinea population
11,812,600
Births this year: 0
Births today 0
Deaths this year 280,749
Deaths today 15
11,812,600
| Region Name | Percents | Number |
|---|---|---|
| Muslim | 85% | 10,279,347 people |
| Christian | 8% | 967,468 people |
| indigenous beliefs | 7% | 846,534 people |
| Ethnic groups Name | Percents | Number |
|---|---|---|
| Peuhl | 40% | 4,837,340 people |
| Malinke | 30% | 3,628,005 people |
| Soussou | 20% | 2,418,670 people |
| smaller ethnic groups | 10% | 1,209,335 people |
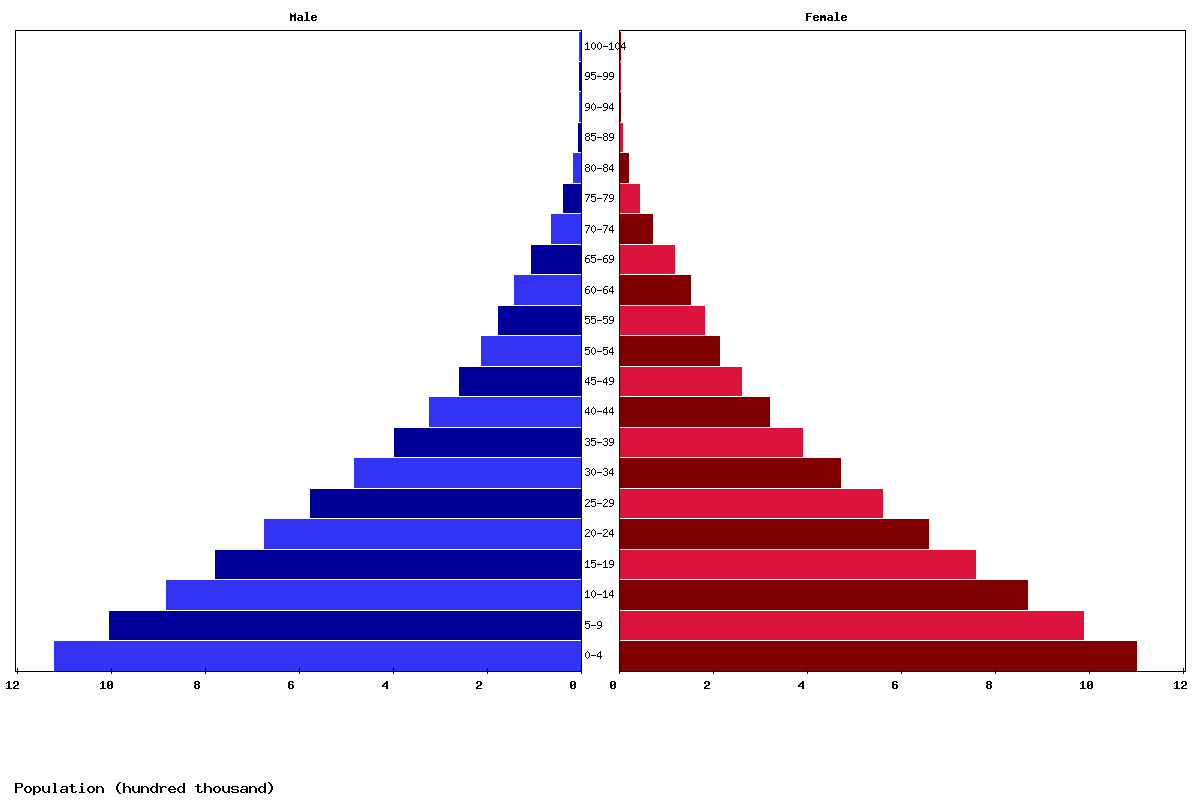
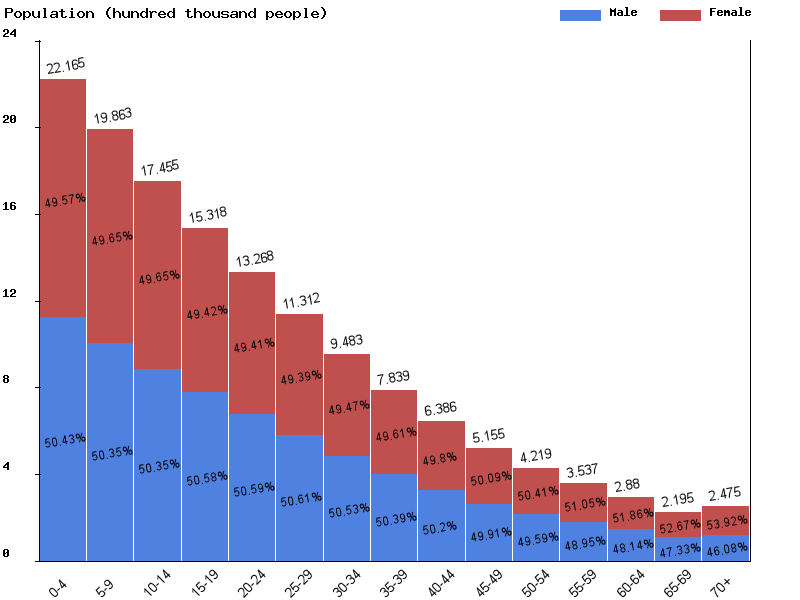
| Age | Both Sexes Population | Male Population | Female Population | Both Sexes (%) | Male (%) | Female (%) | Sex ratio (female/male) |
|---|---|---|---|---|---|---|---|
| Total | 16,246,484 | 8,161,747 | 8,084,737 | 100 | 100 | 100 | 101 |
| 00-04 | 2,384,590 | 1,203,062 | 1,181,528 | 14.7 | 14.7 | 14.6 | 101.8 |
| 05-09 | 2,162,578 | 1,088,985 | 1,073,593 | 13.3 | 13.3 | 13.3 | 101.4 |
| 10-14 | 1,965,264 | 990,791 | 974,473 | 12.1 | 12.1 | 12.1 | 101.7 |
| 15-19 | 1,728,670 | 871,191 | 857,479 | 10.6 | 10.7 | 10.6 | 101.6 |
| 20-24 | 1,509,876 | 764,200 | 745,676 | 9.3 | 9.4 | 9.2 | 102.5 |
| 25-29 | 1,303,938 | 660,117 | 643,821 | 8 | 8.1 | 8 | 102.5 |
| 30-34 | 1,110,183 | 562,479 | 547,704 | 6.8 | 6.9 | 6.8 | 102.7 |
| 35-39 | 928,476 | 469,521 | 458,955 | 5.7 | 5.8 | 5.7 | 102.3 |
| 40-44 | 764,409 | 385,126 | 379,283 | 4.7 | 4.7 | 4.7 | 101.5 |
| 45-49 | 618,916 | 309,950 | 308,966 | 3.8 | 3.8 | 3.8 | 100.3 |
| 50-54 | 494,207 | 245,400 | 248,807 | 3 | 3 | 3.1 | 98.6 |
| 55-59 | 397,089 | 195,293 | 201,796 | 2.4 | 2.4 | 2.5 | 96.8 |
| 60-64 | 322,449 | 156,041 | 166,408 | 2 | 1.9 | 2.1 | 93.8 |
| 65-69 | 248,414 | 118,020 | 130,394 | 1.5 | 1.4 | 1.6 | 90.5 |
| 70-74 | 171,979 | 80,192 | 91,787 | 1.1 | 1 | 1.1 | 87.4 |
| 75-79 | 85,632 | 39,387 | 46,245 | 0.5 | 0.5 | 0.6 | 85.2 |
| 80-84 | 37,649 | 16,845 | 20,804 | 0.2 | 0.2 | 0.3 | 81 |
| 85-89 | 10,444 | 4,466 | 5,978 | 0.1 | 0.1 | 0.1 | 74.7 |
| 90-94 | 1,584 | 631 | 953 | 0 | 0 | 0 | 66.2 |
| 95-99 | 129 | 47 | 82 | 0 | 0 | 0 | 57.3 |
| 100+ | 8 | 3 | 5 | 0 | 0 | 0 | 60 |
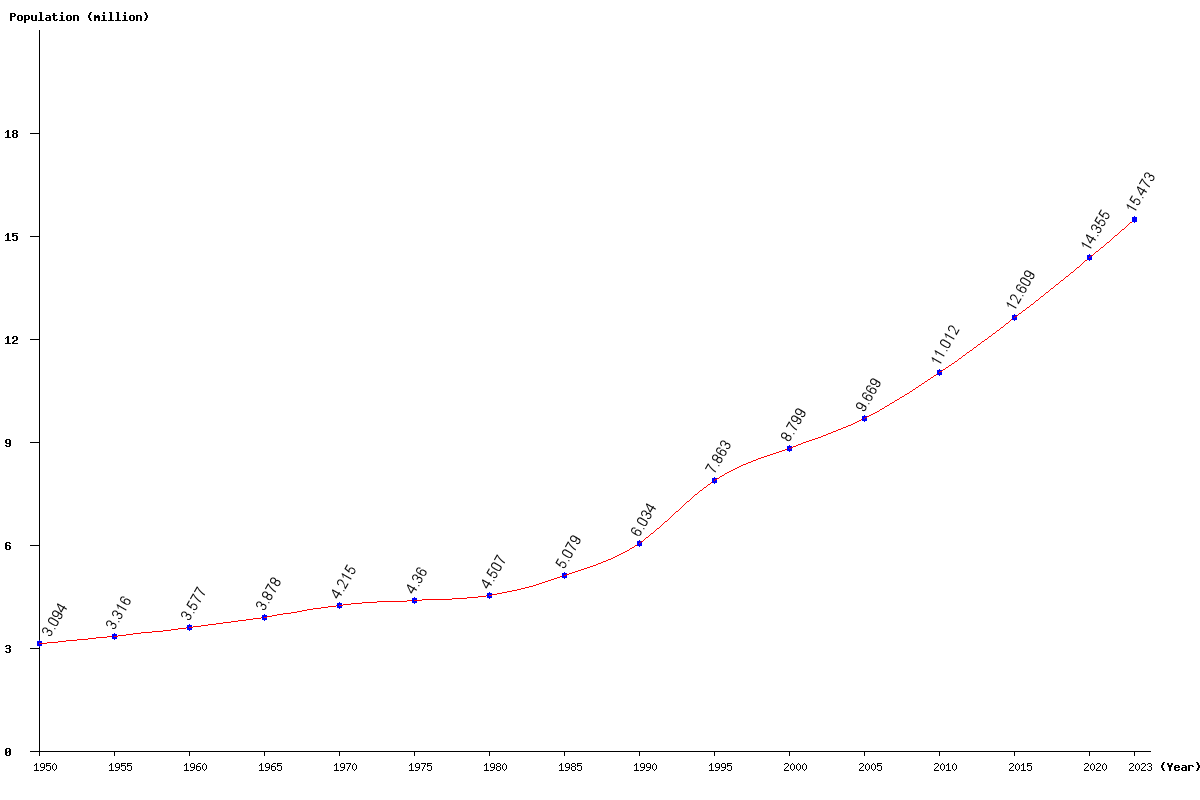
| Year | Population | Yearly % Change |
Yearly Change |
Sex ratio | Density (P/Km²) |
|---|---|---|---|---|---|
| 2024 | 15,856,843 | 2.48 | 384,049 | 100.93 | 64.53 |
| 2023 | 15,472,794 | 2.51 | 378,391 | 100.90 | 62.97 |
| 2022 | 15,094,403 | 2.53 | 372,672 | 100.87 | 61.43 |
| 2021 | 14,721,731 | 2.56 | 366,898 | 100.84 | 59.91 |
| 2020 | 14,354,833 | 2.58 | 360,800 | 100.80 | 58.42 |
| 2019 | 13,994,033 | 2.60 | 354,594 | 100.77 | 56.95 |
| 2018 | 13,639,439 | 2.62 | 348,780 | 100.72 | 55.51 |
| 2017 | 13,290,659 | 2.65 | 343,537 | 100.68 | 54.09 |
| 2016 | 12,947,122 | 2.68 | 338,532 | 100.63 | 52.69 |
| 2015 | 12,608,590 | 2.71 | 333,063 | 100.57 | 51.31 |
| 2014 | 12,275,527 | 2.74 | 326,801 | 100.51 | 49.96 |
| 2013 | 11,948,726 | 2.75 | 319,959 | 100.44 | 48.63 |
| 2012 | 11,628,767 | 2.76 | 312,416 | 100.36 | 47.33 |
| 2011 | 11,316,351 | 2.76 | 303,945 | 100.29 | 46.05 |
| 2010 | 11,012,406 | 2.77 | 296,636 | 100.23 | 44.82 |
| 2005 | 9,669,023 | 9.89 | 869,858 | 99.95 | 39.35 |
| 2000 | 8,799,165 | 11.91 | 936,132 | 99.19 | 35.81 |
| 1995 | 7,863,033 | 30.31 | 1,828,951 | 98.41 | 32.00 |
| 1990 | 6,034,082 | 18.81 | 955,393 | 97.83 | 24.56 |
| 1985 | 5,078,689 | 12.70 | 572,130 | 97.45 | 20.67 |
| 1980 | 4,506,559 | 3.37 | 146,824 | 97.25 | 18.34 |
| 1975 | 4,359,735 | 3.42 | 144,293 | 97.17 | 17.74 |
| 1970 | 4,215,442 | 8.71 | 337,638 | 97.32 | 17.16 |
| 1965 | 3,877,804 | 8.40 | 300,391 | 97.50 | 15.78 |
| 1960 | 3,577,413 | 7.88 | 261,271 | 97.92 | 14.56 |
| 1955 | 3,316,142 | 7.19 | 222,491 | 98.73 | 13.50 |
| 1950 | 3,093,651 | 100.03 | 12.59 |