Grenada population
119,795
Births this year: 17,598
Births today 2
Deaths this year 9,022
Deaths today 1
119,795
| Region Name | Percents | Number |
|---|---|---|
| Roman Catholic | 53% | 58,946 people |
| Anglican | 13.8% | 15,348 people |
| other Protestant | 33.2% | 36,925 people |
| Ethnic groups Name | Percents | Number |
|---|---|---|
| black | 82% | 91,200 people |
| mixed black and European | 13% | 14,458 people |
| European and East Indian | 5% | 5,561 people |
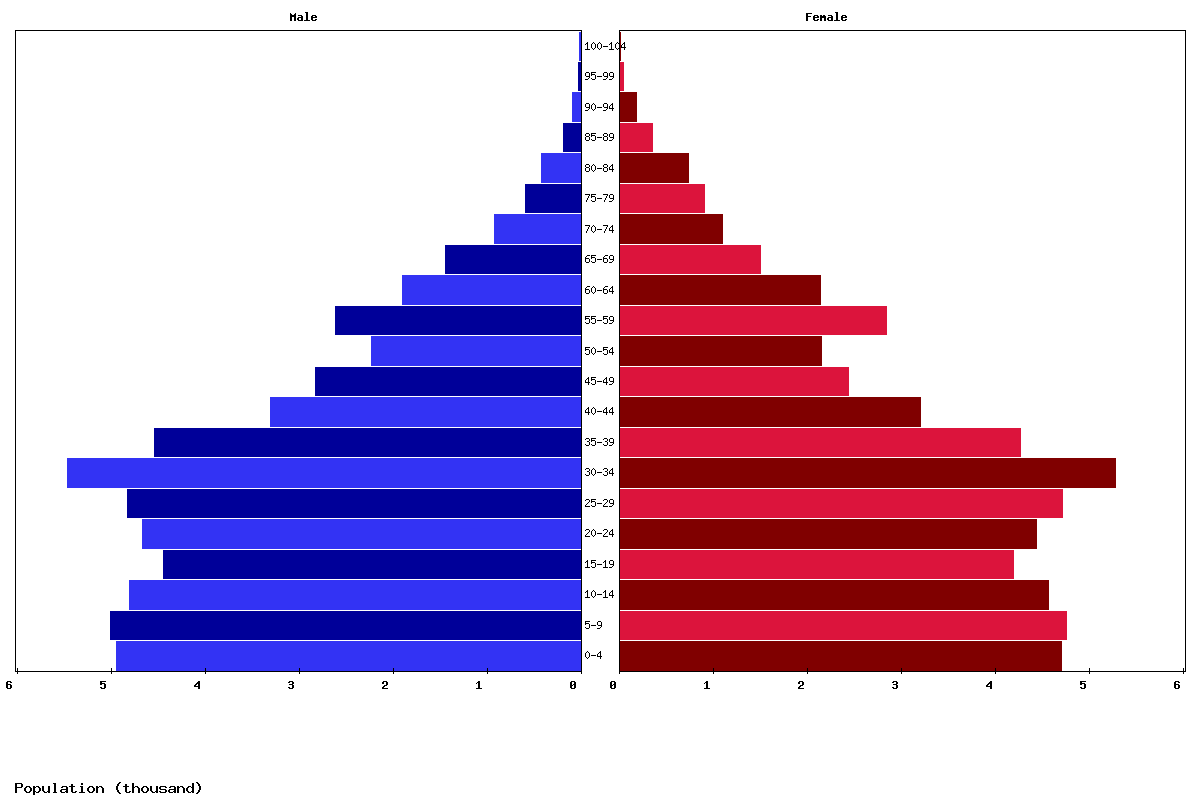
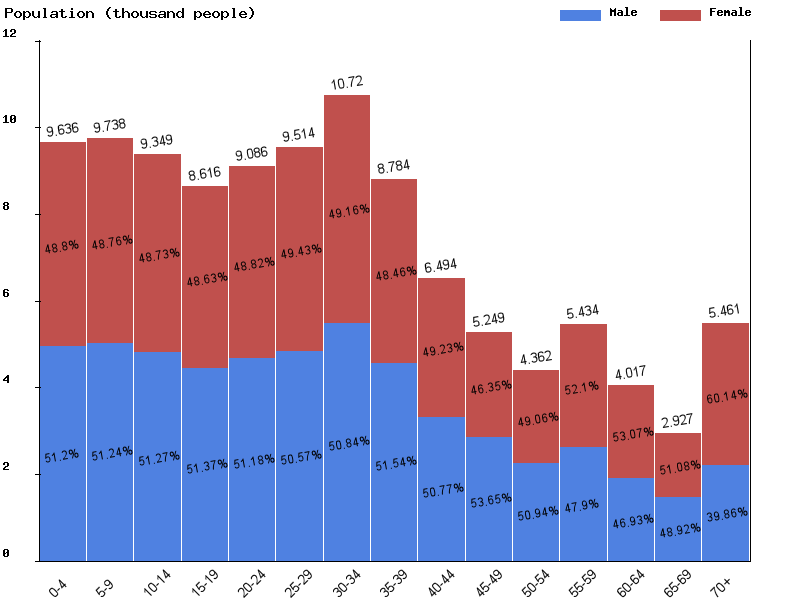
| Age | Both Sexes Population | Male Population | Female Population | Both Sexes (%) | Male (%) | Female (%) | Sex ratio (female/male) |
|---|---|---|---|---|---|---|---|
| Total | 111,318 | 56,062 | 55,256 | 100 | 100 | 100 | 101.5 |
| 00-04 | 8,614 | 4,411 | 4,203 | 7.7 | 7.9 | 7.6 | 104.9 |
| 05-09 | 9,467 | 4,849 | 4,618 | 8.5 | 8.6 | 8.4 | 105 |
| 10-14 | 9,643 | 4,943 | 4,700 | 8.7 | 8.8 | 8.5 | 105.2 |
| 15-19 | 9,106 | 4,676 | 4,430 | 8.2 | 8.3 | 8 | 105.6 |
| 20-24 | 8,064 | 4,158 | 3,906 | 7.2 | 7.4 | 7.1 | 106.5 |
| 25-29 | 8,399 | 4,313 | 4,086 | 7.5 | 7.7 | 7.4 | 105.6 |
| 30-34 | 8,919 | 4,512 | 4,407 | 8 | 8 | 8 | 102.4 |
| 35-39 | 10,257 | 5,209 | 5,048 | 9.2 | 9.3 | 9.1 | 103.2 |
| 40-44 | 8,438 | 4,340 | 4,098 | 7.6 | 7.7 | 7.4 | 105.9 |
| 45-49 | 6,253 | 3,165 | 3,088 | 5.6 | 5.6 | 5.6 | 102.5 |
| 50-54 | 5,045 | 2,695 | 2,350 | 4.5 | 4.8 | 4.3 | 114.7 |
| 55-59 | 4,169 | 2,105 | 2,064 | 3.7 | 3.8 | 3.7 | 102 |
| 60-64 | 5,120 | 2,411 | 2,709 | 4.6 | 4.3 | 4.9 | 89 |
| 65-69 | 3,682 | 1,687 | 1,995 | 3.3 | 3 | 3.6 | 84.6 |
| 70-74 | 2,560 | 1,215 | 1,345 | 2.3 | 2.2 | 2.4 | 90.3 |
| 75-79 | 1,610 | 697 | 913 | 1.4 | 1.2 | 1.7 | 76.3 |
| 80-84 | 1,067 | 375 | 692 | 1 | 0.7 | 1.3 | 54.2 |
| 85-89 | 624 | 212 | 412 | 0.6 | 0.4 | 0.7 | 51.5 |
| 90-94 | 208 | 67 | 141 | 0.2 | 0.1 | 0.3 | 47.5 |
| 95-99 | 66 | 20 | 46 | 0.1 | 0 | 0.1 | 43.5 |
| 100+ | 7 | 2 | 5 | 0 | 0 | 0 | 40 |
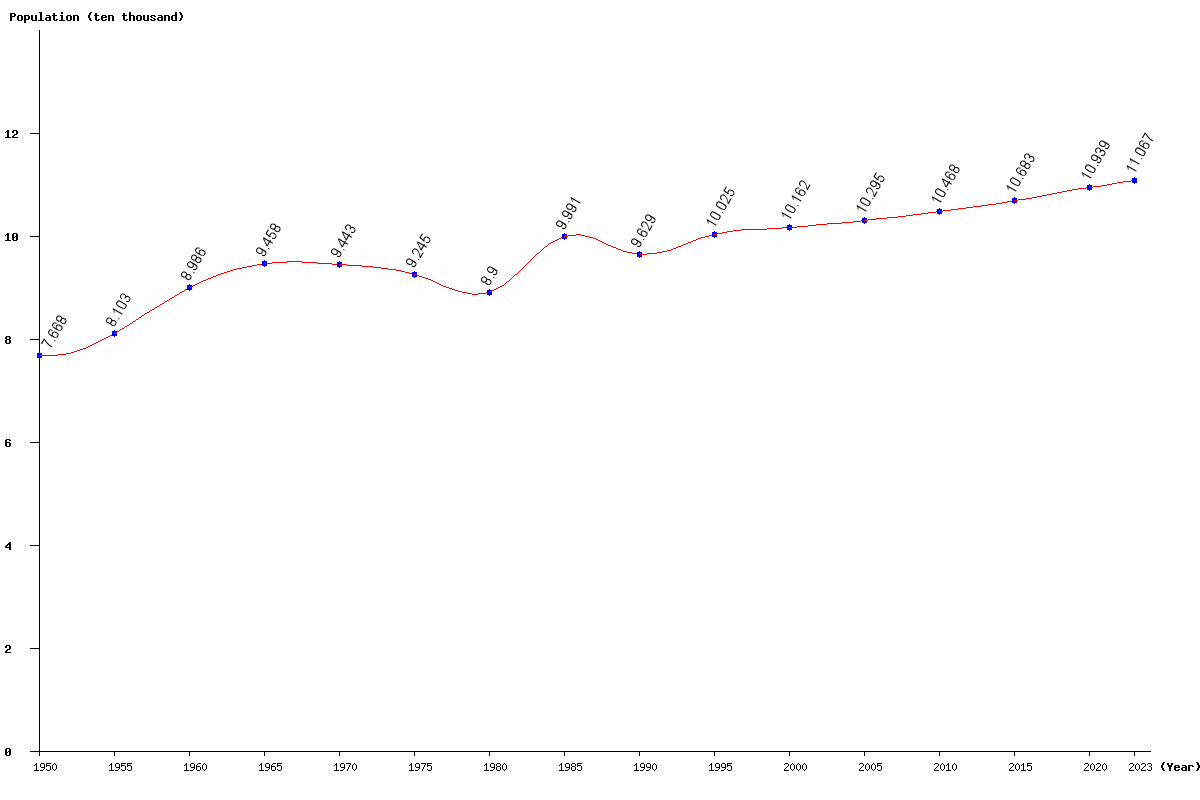
| Year | Population | Yearly % Change |
Yearly Change |
Sex ratio | Density (P/Km²) |
|---|---|---|---|---|---|
| 2025 | 111,318 | 0.27 | 302 | 101.46 | 327.41 |
| 2024 | 111,016 | 0.32 | 349 | 101.42 | 326.52 |
| 2023 | 110,667 | 0.35 | 391 | 101.37 | 325.49 |
| 2022 | 110,276 | 0.39 | 429 | 101.31 | 324.34 |
| 2021 | 109,847 | 0.42 | 460 | 101.25 | 323.08 |
| 2020 | 109,387 | 0.45 | 491 | 101.18 | 321.73 |
| 2019 | 108,896 | 0.48 | 517 | 101.09 | 320.28 |
| 2018 | 108,379 | 0.49 | 529 | 101.00 | 318.76 |
| 2017 | 107,850 | 0.49 | 523 | 100.89 | 317.21 |
| 2016 | 107,327 | 0.47 | 502 | 100.77 | 315.67 |
| 2015 | 106,825 | 0.45 | 476 | 100.64 | 314.19 |
| 2014 | 106,349 | 0.42 | 447 | 100.50 | 312.79 |
| 2013 | 105,902 | 0.40 | 426 | 100.35 | 311.48 |
| 2012 | 105,476 | 0.39 | 406 | 100.19 | 310.22 |
| 2011 | 105,070 | 0.38 | 393 | 100.02 | 309.03 |
| 2010 | 104,677 | 0.36 | 379 | 99.84 | 307.87 |
| 2005 | 102,951 | 1.31 | 1,331 | 98.84 | 302.80 |
| 2000 | 101,620 | 1.36 | 1,367 | 97.79 | 298.88 |
| 1995 | 100,253 | 4.12 | 3,967 | 97.87 | 294.86 |
| 1990 | 96,286 | -3.62 | -3,621 | 97.41 | 283.19 |
| 1985 | 99,907 | 12.25 | 10,903 | 95.09 | 293.84 |
| 1980 | 89,004 | -3.73 | -3,449 | 93.47 | 261.78 |
| 1975 | 92,453 | -2.09 | -1,977 | 91.37 | 271.92 |
| 1970 | 94,430 | -0.16 | -149 | 89.79 | 277.74 |
| 1965 | 94,579 | 5.25 | 4,718 | 88.53 | 278.17 |
| 1960 | 89,861 | 10.90 | 8,833 | 86.56 | 264.30 |
| 1955 | 81,028 | 5.68 | 4,352 | 85.29 | 238.32 |
| 1950 | 76,676 | 84.68 | 225.52 |