Ghana population
2,690,826
Births this year: 0
Births today 0
Deaths this year 0
Deaths today 0
2,690,826
| Region Name | Percents | Number |
|---|---|---|
| Christian (Pentecostal/Charismatic, Protestant, Catholic, other) | 71.2% | 1,915,868 people |
| Muslim | 17.6% | 473,585 people |
| traditional | 5.2% | 139,923 people |
| other | 0.8% | 21,527 people |
| none | 5.2% | 139,923 people |
| Ethnic groups Name | Percents | Number |
|---|---|---|
| Akan | 47.5% | 1,278,142 people |
| Mole-Dagbon | 16.6% | 446,677 people |
| Ewe | 13.9% | 374,025 people |
| Ga-Dangme | 7.4% | 199,121 people |
| Gurma | 5.7% | 153,377 people |
| Guan | 3.7% | 99,561 people |
| Grusi | 2.5% | 67,271 people |
| Mande-Busanga | 1.1% | 29,599 people |
| other | 1.6% | 43,053 people |
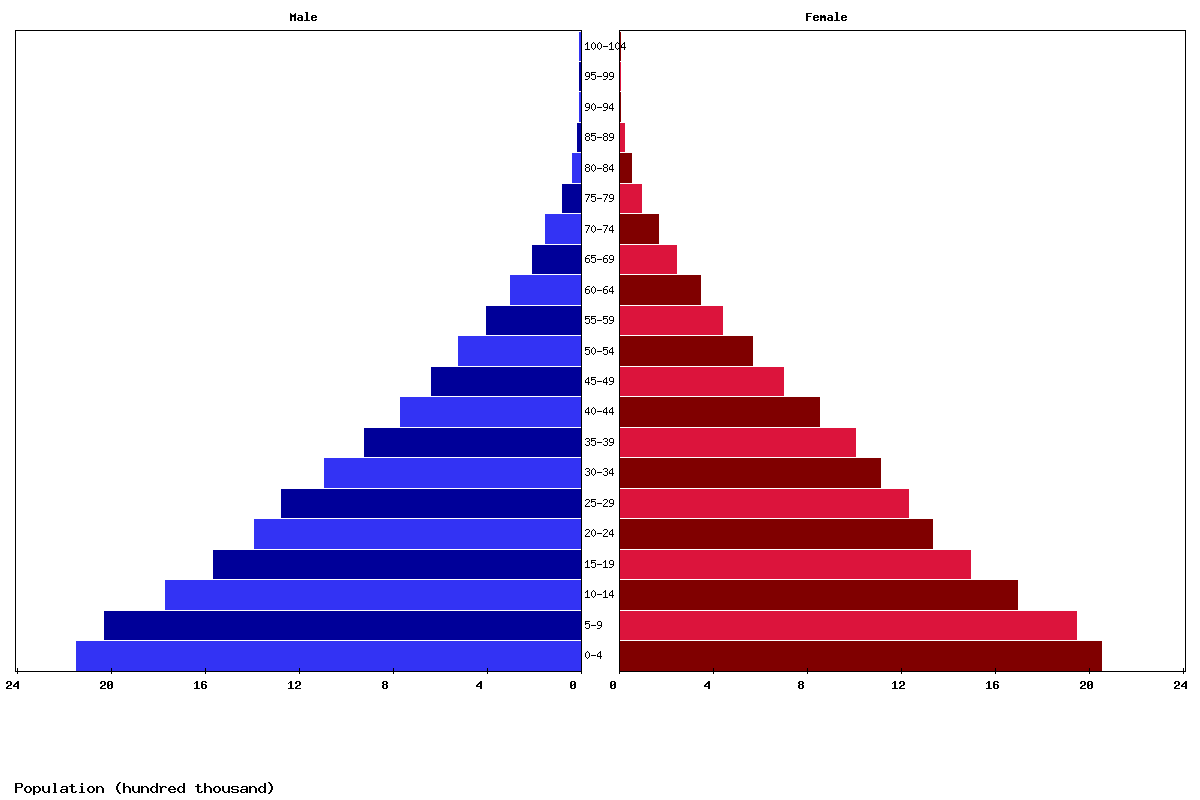
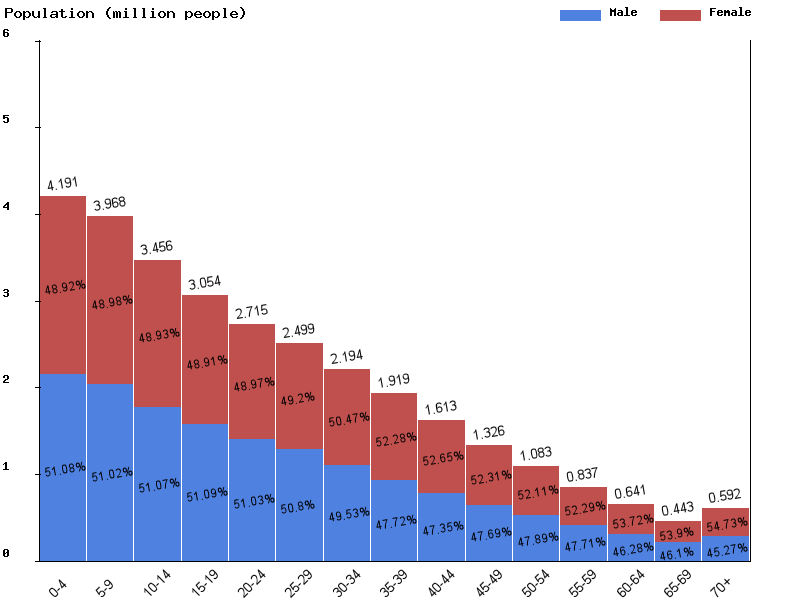
| Age | Both Sexes Population | Male Population | Female Population | Both Sexes (%) | Male (%) | Female (%) | Sex ratio (female/male) |
|---|---|---|---|---|---|---|---|
| Total | 33,678,283 | 16,831,539 | 16,846,744 | 100 | 100 | 100 | 99.9 |
| 00-04 | 4,291,070 | 2,191,784 | 2,099,286 | 12.7 | 13 | 12.5 | 104.4 |
| 05-09 | 4,106,659 | 2,095,308 | 2,011,351 | 12.2 | 12.4 | 11.9 | 104.2 |
| 10-14 | 3,928,313 | 2,005,806 | 1,922,507 | 11.7 | 11.9 | 11.4 | 104.3 |
| 15-19 | 3,419,592 | 1,746,443 | 1,673,149 | 10.2 | 10.4 | 9.9 | 104.4 |
| 20-24 | 2,997,380 | 1,529,261 | 1,468,119 | 8.9 | 9.1 | 8.7 | 104.2 |
| 25-29 | 2,651,655 | 1,350,261 | 1,301,394 | 7.9 | 8 | 7.7 | 103.8 |
| 30-34 | 2,438,451 | 1,236,439 | 1,202,012 | 7.2 | 7.3 | 7.1 | 102.9 |
| 35-39 | 2,138,164 | 1,056,685 | 1,081,479 | 6.3 | 6.3 | 6.4 | 97.7 |
| 40-44 | 1,865,316 | 887,331 | 977,985 | 5.5 | 5.3 | 5.8 | 90.7 |
| 45-49 | 1,559,923 | 734,691 | 825,232 | 4.6 | 4.4 | 4.9 | 89 |
| 50-54 | 1,269,563 | 600,643 | 668,920 | 3.8 | 3.6 | 4 | 89.8 |
| 55-59 | 1,018,996 | 482,445 | 536,551 | 3 | 2.9 | 3.2 | 89.9 |
| 60-64 | 763,384 | 358,768 | 404,616 | 2.3 | 2.1 | 2.4 | 88.7 |
| 65-69 | 555,441 | 252,443 | 302,998 | 1.6 | 1.5 | 1.8 | 83.3 |
| 70-74 | 349,396 | 157,743 | 191,653 | 1 | 0.9 | 1.1 | 82.3 |
| 75-79 | 207,701 | 95,879 | 111,822 | 0.6 | 0.6 | 0.7 | 85.7 |
| 80-84 | 84,185 | 37,303 | 46,882 | 0.2 | 0.2 | 0.3 | 79.6 |
| 85-89 | 27,249 | 10,442 | 16,807 | 0.1 | 0.1 | 0.1 | 62.1 |
| 90-94 | 5,248 | 1,702 | 3,546 | 0 | 0 | 0 | 48 |
| 95-99 | 564 | 153 | 411 | 0 | 0 | 0 | 37.2 |
| 100+ | 33 | 9 | 24 | 0 | 0 | 0 | 37.5 |
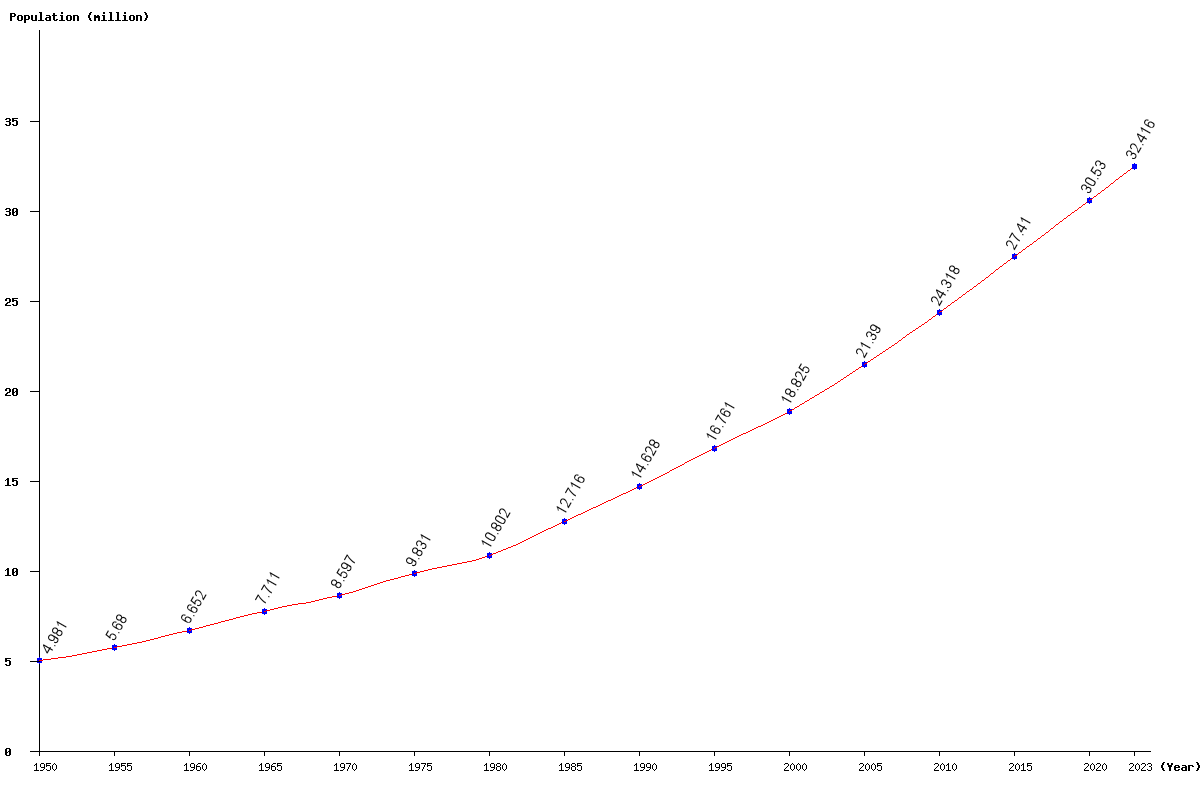
| Year | Population | Yearly % Change |
Yearly Change |
Sex ratio | Density (P/Km²) |
|---|---|---|---|---|---|
| 2024 | 33,046,259 | 1.95 | 630,725 | 99.85 | 145.23 |
| 2023 | 32,415,534 | 1.98 | 629,517 | 99.78 | 142.46 |
| 2022 | 31,786,017 | 2.02 | 628,349 | 99.71 | 139.69 |
| 2021 | 31,157,668 | 2.05 | 627,219 | 99.63 | 136.93 |
| 2020 | 30,530,449 | 2.09 | 625,817 | 99.55 | 134.18 |
| 2019 | 29,904,632 | 2.13 | 624,397 | 99.46 | 131.43 |
| 2018 | 29,280,235 | 2.18 | 623,512 | 99.38 | 128.68 |
| 2017 | 28,656,723 | 2.22 | 623,348 | 99.29 | 125.94 |
| 2016 | 28,033,375 | 2.27 | 623,482 | 99.16 | 123.20 |
| 2015 | 27,409,893 | 2.33 | 623,295 | 98.99 | 120.46 |
| 2014 | 26,786,598 | 2.38 | 622,166 | 98.76 | 117.72 |
| 2013 | 26,164,432 | 2.43 | 619,867 | 98.48 | 114.99 |
| 2012 | 25,544,565 | 2.47 | 616,062 | 98.21 | 112.26 |
| 2011 | 24,928,503 | 2.51 | 610,769 | 98.02 | 109.56 |
| 2010 | 24,317,734 | 2.55 | 604,570 | 97.98 | 106.87 |
| 2005 | 21,389,514 | 13.62 | 2,564,520 | 99.83 | 94.00 |
| 2000 | 18,824,994 | 12.31 | 2,064,003 | 102.03 | 82.73 |
| 1995 | 16,760,991 | 14.58 | 2,132,731 | 102.26 | 73.66 |
| 1990 | 14,628,260 | 15.04 | 1,912,022 | 103.32 | 64.29 |
| 1985 | 12,716,238 | 17.72 | 1,914,213 | 103.27 | 55.89 |
| 1980 | 10,802,025 | 9.87 | 970,616 | 103.35 | 47.47 |
| 1975 | 9,831,409 | 14.36 | 1,234,432 | 103.52 | 43.21 |
| 1970 | 8,596,977 | 11.50 | 886,430 | 103.79 | 37.78 |
| 1965 | 7,710,547 | 15.91 | 1,058,262 | 103.61 | 33.89 |
| 1960 | 6,652,285 | 17.11 | 971,879 | 103.30 | 29.24 |
| 1955 | 5,680,406 | 14.04 | 699,528 | 102.80 | 24.96 |
| 1950 | 4,980,878 | 102.22 | 21.89 |