Georgia population
5,004,700
Births this year: 598,814
Births today 22
Deaths this year 522,166
Deaths today 19
5,004,700
| Region Name | Percents | Number |
|---|---|---|
| Orthodox Christian (official) | 83.9% | 4,134,636 people |
| Muslim | 9.9% | 487,877 people |
| Armenian-Gregorian | 3.9% | 192,194 people |
| Catholic | 0.8% | 39,424 people |
| other | 0.8% | 39,424 people |
| none | 0.7% | 34,496 people |
| Ethnic groups Name | Percents | Number |
|---|---|---|
| Georgian | 83.8% | 4,129,708 people |
| Azeri | 6.5% | 320,323 people |
| Armenian | 5.7% | 280,899 people |
| Russian | 1.5% | 73,921 people |
| other | 2.5% | 123,201 people |
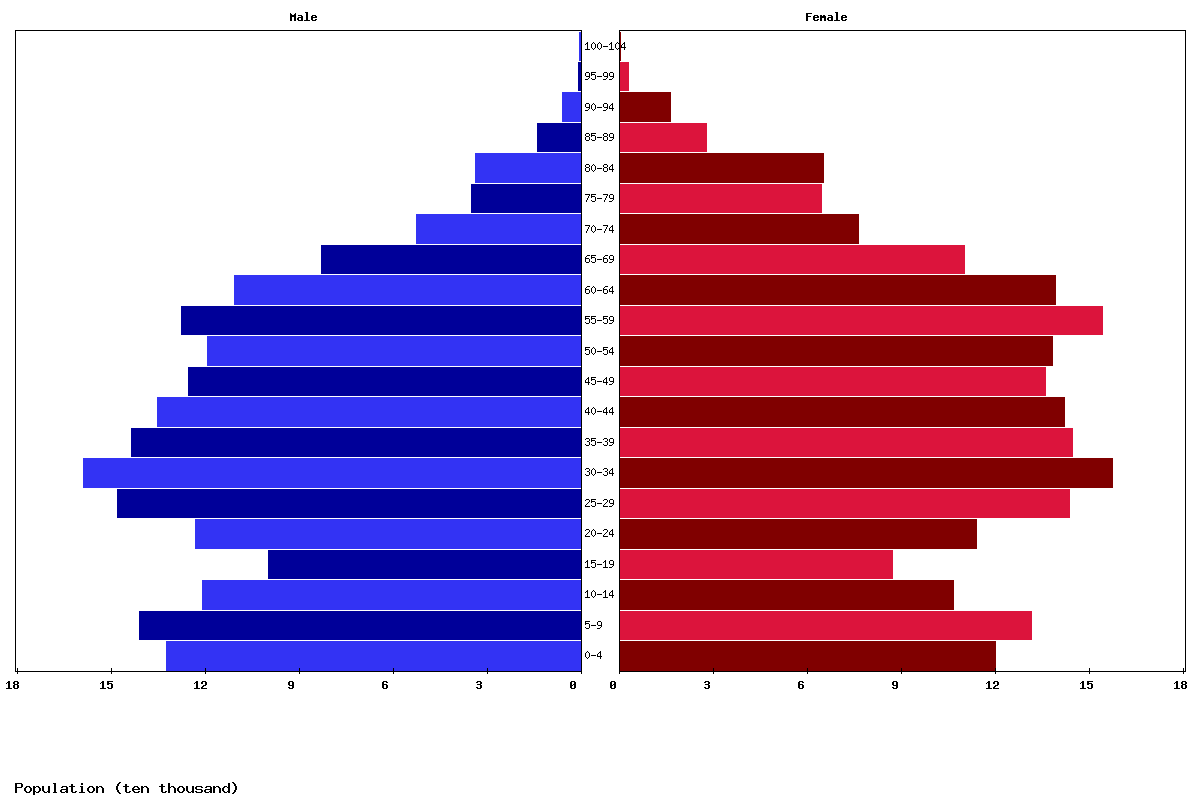
| Age | Both Sexes Population | Male Population | Female Population | Both Sexes (%) | Male (%) | Female (%) | Sex ratio (female/male) |
|---|---|---|---|---|---|---|---|
| Total | 3,934,208 | 1,887,406 | 2,046,802 | 100 | 100 | 100 | 92.2 |
| 00-04 | 226,493 | 118,416 | 108,077 | 5.8 | 6.3 | 5.3 | 109.6 |
| 05-09 | 249,329 | 130,588 | 118,741 | 6.3 | 6.9 | 5.8 | 110 |
| 10-14 | 270,845 | 140,017 | 130,828 | 6.9 | 7.4 | 6.4 | 107 |
| 15-19 | 223,597 | 118,722 | 104,875 | 5.7 | 6.3 | 5.1 | 113.2 |
| 20-24 | 178,166 | 95,019 | 83,147 | 4.5 | 5 | 4.1 | 114.3 |
| 25-29 | 226,097 | 117,109 | 108,988 | 5.7 | 6.2 | 5.3 | 107.5 |
| 30-34 | 281,446 | 142,007 | 139,439 | 7.2 | 7.5 | 6.8 | 101.8 |
| 35-39 | 307,792 | 153,688 | 154,104 | 7.8 | 8.1 | 7.5 | 99.7 |
| 40-44 | 280,835 | 138,908 | 141,927 | 7.1 | 7.4 | 6.9 | 97.9 |
| 45-49 | 270,431 | 130,699 | 139,732 | 6.9 | 6.9 | 6.8 | 93.5 |
| 50-54 | 254,004 | 120,196 | 133,808 | 6.5 | 6.4 | 6.5 | 89.8 |
| 55-59 | 248,358 | 112,981 | 135,377 | 6.3 | 6 | 6.6 | 83.5 |
| 60-64 | 267,517 | 118,395 | 149,122 | 6.8 | 6.3 | 7.3 | 79.4 |
| 65-69 | 230,392 | 98,886 | 131,506 | 5.9 | 5.2 | 6.4 | 75.2 |
| 70-74 | 168,758 | 68,985 | 99,773 | 4.3 | 3.7 | 4.9 | 69.1 |
| 75-79 | 102,930 | 38,979 | 63,951 | 2.6 | 2.1 | 3.1 | 61 |
| 80-84 | 69,298 | 21,737 | 47,561 | 1.8 | 1.2 | 2.3 | 45.7 |
| 85-89 | 55,041 | 16,216 | 38,825 | 1.4 | 0.9 | 1.9 | 41.8 |
| 90-94 | 16,566 | 4,572 | 11,994 | 0.4 | 0.2 | 0.6 | 38.1 |
| 95-99 | 5,746 | 1,207 | 4,539 | 0.1 | 0.1 | 0.2 | 26.6 |
| 100+ | 567 | 79 | 488 | 0 | 0 | 0 | 16.2 |
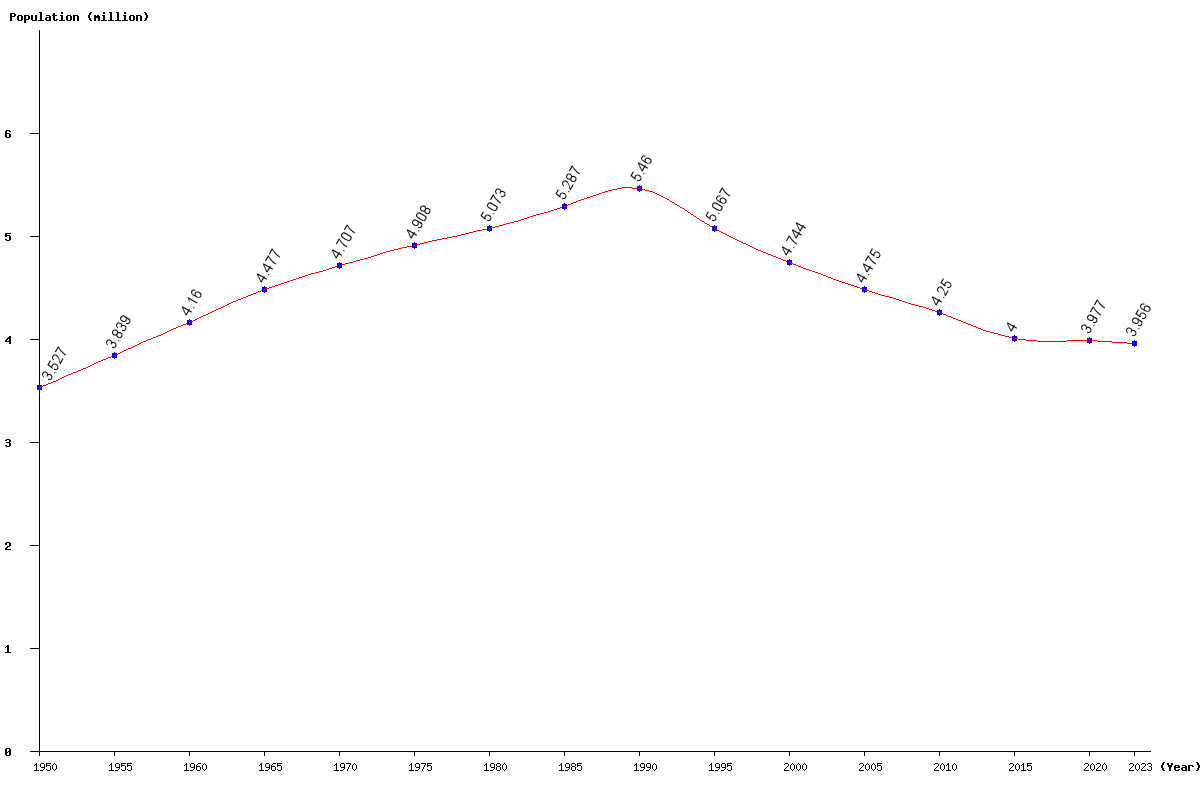
| Year | Population | Yearly % Change |
Yearly Change |
Sex ratio | Density (P/Km²) |
|---|---|---|---|---|---|
| 2025 | 3,934,208 | -0.28 | -10,996 | 92.21 | 56.62 |
| 2024 | 3,945,204 | -0.28 | -10,885 | 92.12 | 56.77 |
| 2023 | 3,956,089 | -0.25 | -9,753 | 92.03 | 56.93 |
| 2022 | 3,965,842 | -0.18 | -7,188 | 91.93 | 57.07 |
| 2021 | 3,973,030 | -0.10 | -3,998 | 91.83 | 57.17 |
| 2020 | 3,977,028 | 0.01 | 251 | 91.73 | 57.23 |
| 2019 | 3,976,777 | 0.08 | 3,096 | 91.64 | 57.23 |
| 2018 | 3,973,681 | 0.03 | 1,149 | 91.55 | 57.18 |
| 2017 | 3,972,532 | -0.18 | -7,249 | 91.46 | 57.17 |
| 2016 | 3,979,781 | -0.50 | -20,031 | 91.35 | 57.27 |
| 2015 | 3,999,812 | -0.87 | -34,962 | 91.23 | 57.56 |
| 2014 | 4,034,774 | -1.17 | -47,953 | 91.09 | 58.06 |
| 2013 | 4,082,727 | -1.36 | -56,193 | 90.95 | 58.75 |
| 2012 | 4,138,920 | -1.37 | -57,481 | 90.79 | 59.56 |
| 2011 | 4,196,401 | -1.26 | -53,731 | 90.61 | 60.39 |
| 2010 | 4,250,132 | -1.13 | -48,459 | 90.39 | 61.16 |
| 2005 | 4,475,273 | -5.66 | -268,318 | 89.29 | 64.40 |
| 2000 | 4,743,591 | -6.39 | -323,552 | 89.85 | 68.26 |
| 1995 | 5,067,143 | -7.20 | -393,166 | 90.42 | 72.92 |
| 1990 | 5,460,309 | 3.27 | 172,981 | 90.58 | 78.58 |
| 1985 | 5,287,328 | 4.22 | 214,087 | 89.49 | 76.09 |
| 1980 | 5,073,241 | 3.36 | 164,976 | 88.42 | 73.01 |
| 1975 | 4,908,265 | 4.27 | 200,938 | 88.59 | 70.63 |
| 1970 | 4,707,327 | 5.14 | 229,999 | 88.57 | 67.74 |
| 1965 | 4,477,328 | 7.63 | 317,559 | 88.01 | 64.43 |
| 1960 | 4,159,769 | 8.34 | 320,305 | 87.12 | 59.86 |
| 1955 | 3,839,464 | 8.86 | 312,460 | 86.31 | 55.25 |
| 1950 | 3,527,004 | 85.85 | 50.76 |