Gambia population
2,009,648
Births this year: 0
Births today 0
Deaths this year 0
Deaths today 0
2,009,648
| Region Name | Percents | Number |
|---|---|---|
| Muslim | 90% | 1,808,683 people |
| Christian | 8% | 160,772 people |
| indigenous beliefs | 2% | 40,193 people |
| Ethnic groups Name | Percents | Number |
|---|---|---|
| African (Mandinka, Fula, Wolof, Jola, Serahuli, other) | 99% | 1,989,552 people |
| non-African | 1% | 20,096 people |
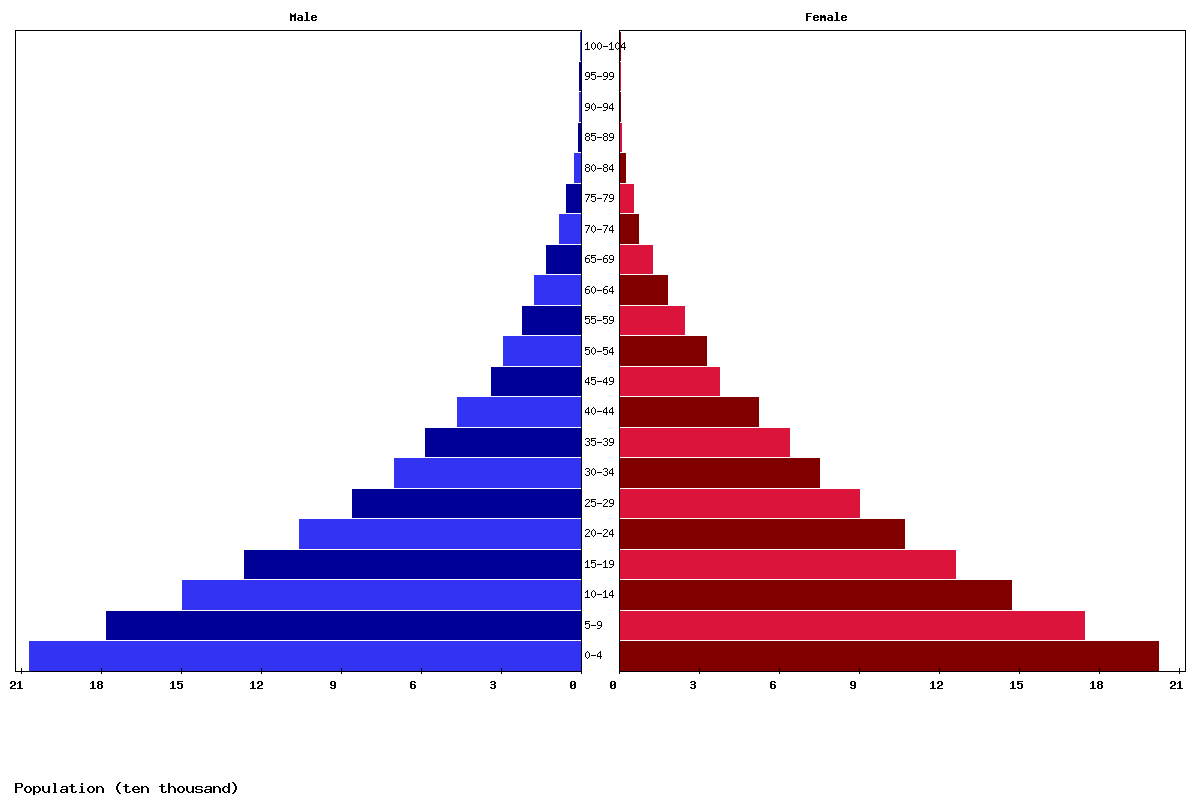
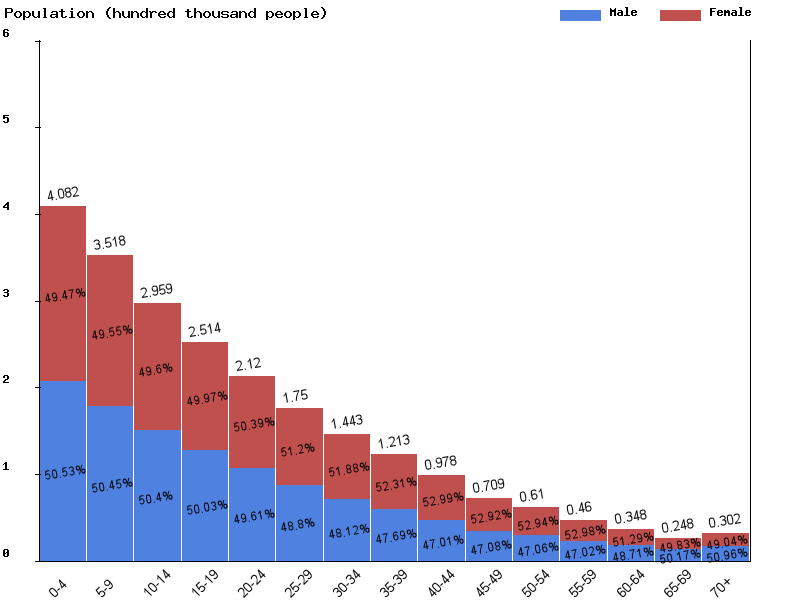
| Age | Both Sexes Population | Male Population | Female Population | Both Sexes (%) | Male (%) | Female (%) | Sex ratio (female/male) |
|---|---|---|---|---|---|---|---|
| Total | 2,697,535 | 1,335,524 | 1,362,011 | 100 | 100 | 100 | 98.1 |
| 00-04 | 452,332 | 228,634 | 223,698 | 16.8 | 17.1 | 16.4 | 102.2 |
| 05-09 | 393,717 | 198,640 | 195,077 | 14.6 | 14.9 | 14.3 | 101.8 |
| 10-14 | 346,318 | 174,463 | 171,855 | 12.8 | 13.1 | 12.6 | 101.5 |
| 15-19 | 295,047 | 148,026 | 147,021 | 10.9 | 11.1 | 10.8 | 100.7 |
| 20-24 | 251,164 | 124,687 | 126,477 | 9.3 | 9.3 | 9.3 | 98.6 |
| 25-29 | 209,162 | 102,969 | 106,193 | 7.8 | 7.7 | 7.8 | 97 |
| 30-34 | 168,972 | 82,272 | 86,700 | 6.3 | 6.2 | 6.4 | 94.9 |
| 35-39 | 137,929 | 66,419 | 71,510 | 5.1 | 5 | 5.3 | 92.9 |
| 40-44 | 115,341 | 55,129 | 60,212 | 4.3 | 4.1 | 4.4 | 91.6 |
| 45-49 | 93,258 | 43,779 | 49,479 | 3.5 | 3.3 | 3.6 | 88.5 |
| 50-54 | 67,353 | 31,463 | 35,890 | 2.5 | 2.4 | 2.6 | 87.7 |
| 55-59 | 57,258 | 26,634 | 30,624 | 2.1 | 2 | 2.2 | 87 |
| 60-64 | 42,307 | 19,584 | 22,723 | 1.6 | 1.5 | 1.7 | 86.2 |
| 65-69 | 30,600 | 14,652 | 15,948 | 1.1 | 1.1 | 1.2 | 91.9 |
| 70-74 | 20,170 | 9,910 | 10,260 | 0.7 | 0.7 | 0.8 | 96.6 |
| 75-79 | 10,009 | 5,165 | 4,844 | 0.4 | 0.4 | 0.4 | 106.6 |
| 80-84 | 5,070 | 2,403 | 2,667 | 0.2 | 0.2 | 0.2 | 90.1 |
| 85-89 | 1,300 | 600 | 700 | 0 | 0 | 0.1 | 85.7 |
| 90-94 | 209 | 88 | 121 | 0 | 0 | 0 | 72.7 |
| 95-99 | 18 | 7 | 11 | 0 | 0 | 0 | 63.6 |
| 100+ | 1 | 0 | 1 | 0 | 0 | 0 | 0 |
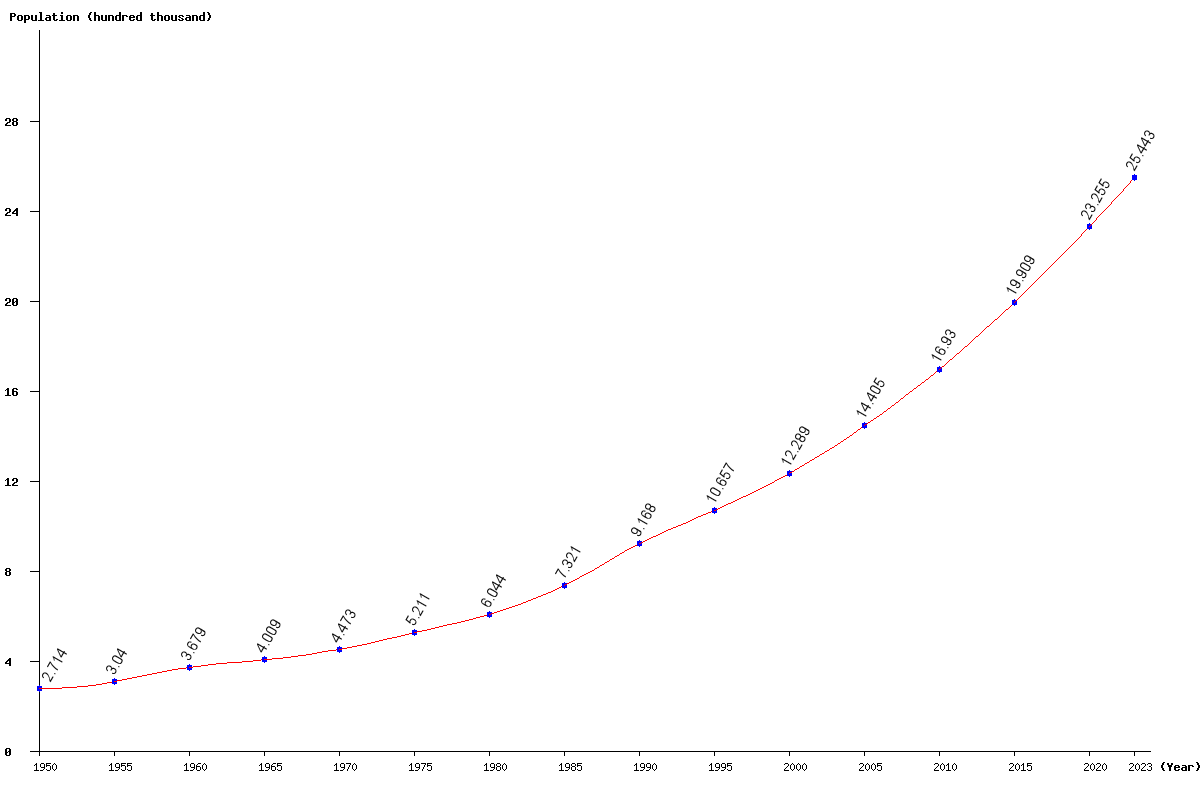
| Year | Population | Yearly % Change |
Yearly Change |
Sex ratio | Density (P/Km²) |
|---|---|---|---|---|---|
| 2025 | 2,697,535 | 2.95 | 77,319 | 98.06 | 266.55 |
| 2024 | 2,620,216 | 2.98 | 75,890 | 98.04 | 258.91 |
| 2023 | 2,544,326 | 3.01 | 74,433 | 98.03 | 251.42 |
| 2022 | 2,469,893 | 3.04 | 72,949 | 98.02 | 244.06 |
| 2021 | 2,396,944 | 3.07 | 71,441 | 98.01 | 236.85 |
| 2020 | 2,325,503 | 3.10 | 69,895 | 98.01 | 229.79 |
| 2019 | 2,255,608 | 3.12 | 68,343 | 98.01 | 222.89 |
| 2018 | 2,187,265 | 3.15 | 66,847 | 98.01 | 216.13 |
| 2017 | 2,120,418 | 3.18 | 65,432 | 98.01 | 209.53 |
| 2016 | 2,054,986 | 3.22 | 64,062 | 98.02 | 203.06 |
| 2015 | 1,990,924 | 3.25 | 62,723 | 98.02 | 196.73 |
| 2014 | 1,928,201 | 3.28 | 61,323 | 98.04 | 190.53 |
| 2013 | 1,866,878 | 3.31 | 59,770 | 98.05 | 184.47 |
| 2012 | 1,807,108 | 3.32 | 58,009 | 98.07 | 178.57 |
| 2011 | 1,749,099 | 3.31 | 56,097 | 98.09 | 172.84 |
| 2010 | 1,693,002 | 3.30 | 54,103 | 98.11 | 167.29 |
| 2005 | 1,440,542 | 17.23 | 211,679 | 98.31 | 142.35 |
| 2000 | 1,228,863 | 15.31 | 163,117 | 98.65 | 121.43 |
| 1995 | 1,065,746 | 16.24 | 148,935 | 100.09 | 105.31 |
| 1990 | 916,811 | 25.23 | 184,719 | 101.39 | 90.59 |
| 1985 | 732,092 | 21.13 | 127,721 | 99.40 | 72.34 |
| 1980 | 604,371 | 15.99 | 83,301 | 98.37 | 59.72 |
| 1975 | 521,070 | 16.50 | 73,787 | 101.72 | 51.49 |
| 1970 | 447,283 | 11.58 | 46,418 | 104.79 | 44.20 |
| 1965 | 400,865 | 8.95 | 32,936 | 100.10 | 39.61 |
| 1960 | 367,929 | 21.02 | 63,896 | 96.81 | 36.36 |
| 1955 | 304,033 | 12.04 | 32,661 | 95.67 | 30.04 |
| 1950 | 271,372 | 94.95 | 26.82 |