Gabon population
170,530
Births this year: 0
Births today 0
Deaths this year 3,324
Deaths today 0
170,530
| Region Name | Percents | Number |
|---|---|---|
| Christian | 65% | 113,005 people |
| other | 35% | 60,849 people |
| Ethnic groups Name | Percents | Number |
|---|---|---|
| Bantu tribes, including four major tribal groupings (Fang, Bapounou, Nzebi, Obamba) | 99.9% | 173,680 people |
| other Africans and Europeans | 154,000 people |
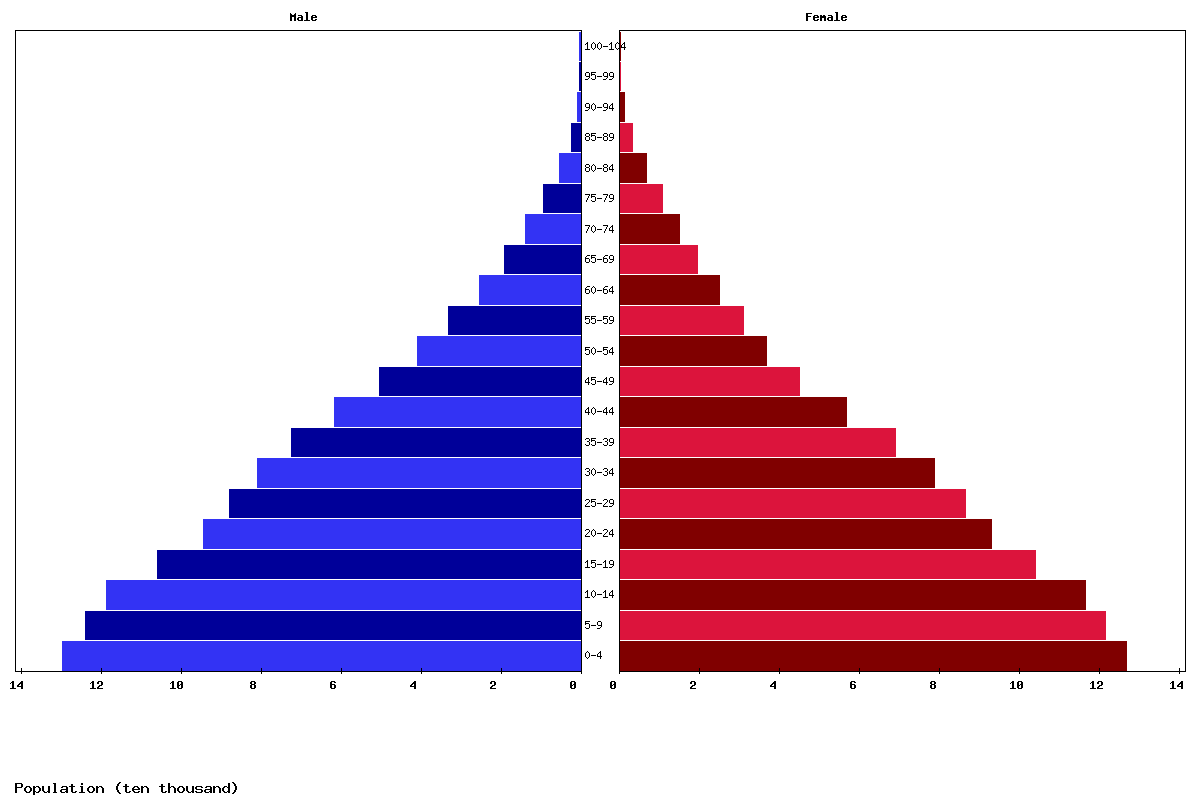
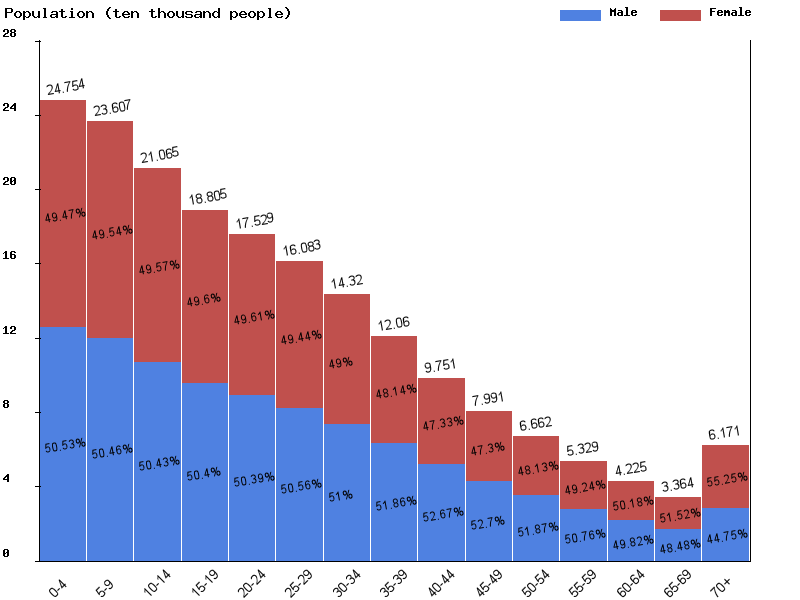
| Age | Both Sexes Population | Male Population | Female Population | Both Sexes (%) | Male (%) | Female (%) | Sex ratio (female/male) |
|---|---|---|---|---|---|---|---|
| Total | 2,116,081 | 1,071,511 | 1,044,570 | 100 | 100 | 100 | 102.6 |
| 00-04 | 256,042 | 129,424 | 126,618 | 12.1 | 12.1 | 12.1 | 102.2 |
| 05-09 | 245,025 | 123,647 | 121,378 | 11.6 | 11.5 | 11.6 | 101.9 |
| 10-14 | 234,828 | 118,422 | 116,406 | 11.1 | 11.1 | 11.1 | 101.7 |
| 15-19 | 209,400 | 105,548 | 103,852 | 9.9 | 9.9 | 9.9 | 101.6 |
| 20-24 | 186,906 | 94,117 | 92,789 | 8.8 | 8.8 | 8.9 | 101.4 |
| 25-29 | 174,007 | 87,706 | 86,301 | 8.2 | 8.2 | 8.3 | 101.6 |
| 30-34 | 159,072 | 80,572 | 78,500 | 7.5 | 7.5 | 7.5 | 102.6 |
| 35-39 | 140,867 | 72,046 | 68,821 | 6.7 | 6.7 | 6.6 | 104.7 |
| 40-44 | 117,940 | 61,362 | 56,578 | 5.6 | 5.7 | 5.4 | 108.5 |
| 45-49 | 94,937 | 50,097 | 44,840 | 4.5 | 4.7 | 4.3 | 111.7 |
| 50-54 | 77,259 | 40,668 | 36,591 | 3.7 | 3.8 | 3.5 | 111.1 |
| 55-59 | 63,801 | 32,933 | 30,868 | 3 | 3.1 | 3 | 106.7 |
| 60-64 | 50,141 | 25,241 | 24,900 | 2.4 | 2.4 | 2.4 | 101.4 |
| 65-69 | 38,322 | 18,854 | 19,468 | 1.8 | 1.8 | 1.9 | 96.8 |
| 70-74 | 28,689 | 13,693 | 14,996 | 1.4 | 1.3 | 1.4 | 91.3 |
| 75-79 | 19,704 | 9,194 | 10,510 | 0.9 | 0.9 | 1 | 87.5 |
| 80-84 | 11,795 | 5,078 | 6,717 | 0.6 | 0.5 | 0.6 | 75.6 |
| 85-89 | 5,391 | 2,200 | 3,191 | 0.3 | 0.2 | 0.3 | 68.9 |
| 90-94 | 1,651 | 612 | 1,039 | 0.1 | 0.1 | 0.1 | 58.9 |
| 95-99 | 279 | 90 | 189 | 0 | 0 | 0 | 47.6 |
| 100+ | 25 | 7 | 18 | 0 | 0 | 0 | 38.9 |
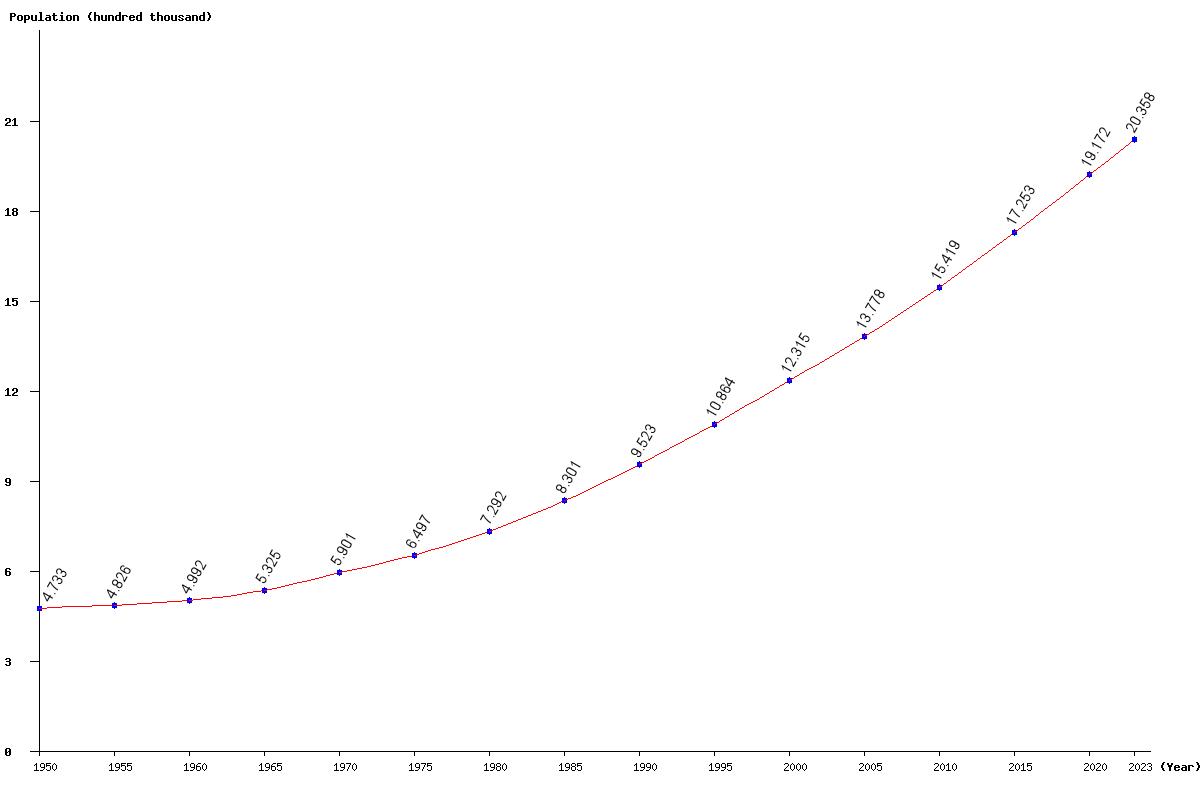
| Year | Population | Yearly % Change |
Yearly Change |
Sex ratio | Density (P/Km²) |
|---|---|---|---|---|---|
| 2025 | 2,116,081 | 1.94 | 40,284 | 102.58 | 8.21 |
| 2024 | 2,075,797 | 1.97 | 40,044 | 102.58 | 8.06 |
| 2023 | 2,035,753 | 1.99 | 39,791 | 102.57 | 7.90 |
| 2022 | 1,995,962 | 2.02 | 39,532 | 102.56 | 7.75 |
| 2021 | 1,956,430 | 2.05 | 39,261 | 102.54 | 7.59 |
| 2020 | 1,917,169 | 2.07 | 38,957 | 102.51 | 7.44 |
| 2019 | 1,878,212 | 2.10 | 38,637 | 102.49 | 7.29 |
| 2018 | 1,839,575 | 2.13 | 38,343 | 102.45 | 7.14 |
| 2017 | 1,801,232 | 2.16 | 38,090 | 102.41 | 6.99 |
| 2016 | 1,763,142 | 2.19 | 37,850 | 102.35 | 6.84 |
| 2015 | 1,725,292 | 2.23 | 37,619 | 102.29 | 6.70 |
| 2014 | 1,687,673 | 2.26 | 37,322 | 102.23 | 6.55 |
| 2013 | 1,650,351 | 2.28 | 36,862 | 102.15 | 6.40 |
| 2012 | 1,613,489 | 2.29 | 36,191 | 102.06 | 6.26 |
| 2011 | 1,577,298 | 2.29 | 35,362 | 101.93 | 6.12 |
| 2010 | 1,541,936 | 2.29 | 34,508 | 101.75 | 5.98 |
| 2005 | 1,377,777 | 11.87 | 146,229 | 100.25 | 5.35 |
| 2000 | 1,231,548 | 13.36 | 145,099 | 98.58 | 4.78 |
| 1995 | 1,086,449 | 14.09 | 134,180 | 96.92 | 4.22 |
| 1990 | 952,269 | 14.72 | 122,178 | 96.00 | 3.70 |
| 1985 | 830,091 | 13.84 | 100,926 | 95.00 | 3.22 |
| 1980 | 729,165 | 12.23 | 79,446 | 93.95 | 2.83 |
| 1975 | 649,719 | 10.10 | 59,600 | 92.91 | 2.52 |
| 1970 | 590,119 | 10.82 | 57,607 | 91.94 | 2.29 |
| 1965 | 532,512 | 6.68 | 33,323 | 94.17 | 2.07 |
| 1960 | 499,189 | 3.45 | 16,631 | 95.34 | 1.94 |
| 1955 | 482,558 | 1.96 | 9,258 | 95.22 | 1.87 |
| 1950 | 473,300 | 95.20 | 1.84 |