France population
6,884,419
Births this year: 823,297
Births today 86
Deaths this year 622,493
Deaths today 65
6,884,419
| Region Name | Percents | Number |
|---|---|---|
| Roman Catholic | 85.5% | 5,714,491 people |
| Protestant | 2% | 133,672 people |
| Jewish | 1% | 66,836 people |
| Muslim | 7.5% | 501,271 people |
| unaffiliated | 4% | 267,345 people |
| Ethnic groups Name | Percents | Number |
|---|---|---|
| Celtic and Latin with Teutonic, Slavic, North African, Indochinese, Basque minorities | 100% | 6,683,615 people |
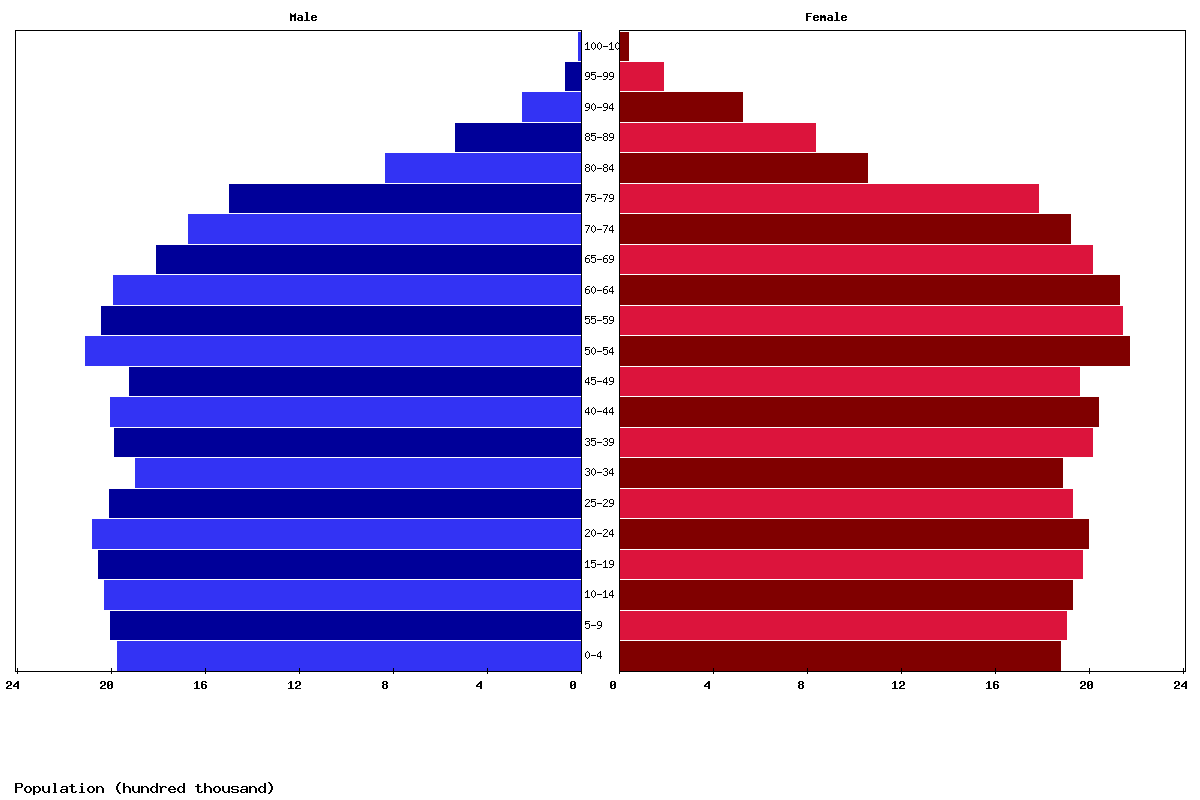
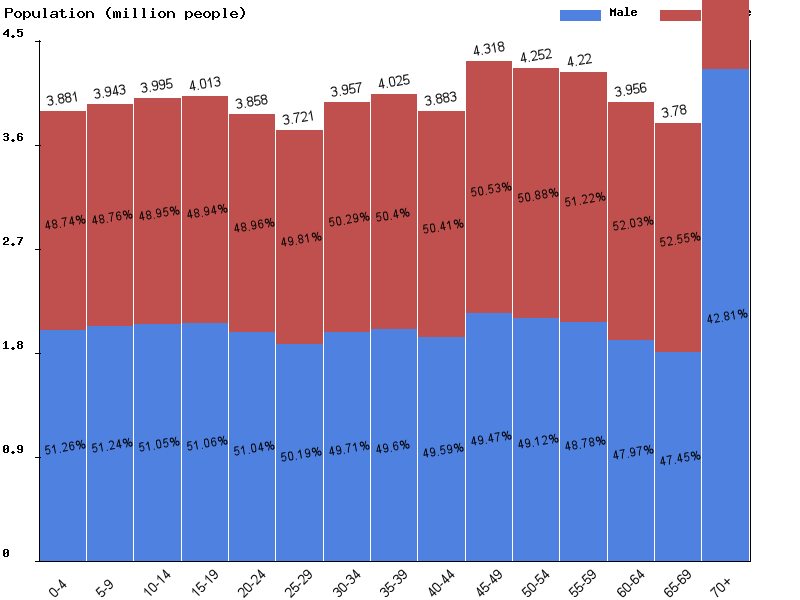
| Age | Both Sexes Population | Male Population | Female Population | Both Sexes (%) | Male (%) | Female (%) | Sex ratio (female/male) |
|---|---|---|---|---|---|---|---|
| Total | 66,895,621 | 32,661,371 | 34,234,250 | 100 | 100 | 100 | 95.4 |
| 00-04 | 3,841,845 | 1,969,284 | 1,872,561 | 5.7 | 6 | 5.5 | 105.2 |
| 05-09 | 3,897,358 | 1,997,445 | 1,899,913 | 5.8 | 6.1 | 5.5 | 105.1 |
| 10-14 | 3,951,066 | 2,024,365 | 1,926,701 | 5.9 | 6.2 | 5.6 | 105.1 |
| 15-19 | 4,018,469 | 2,050,292 | 1,968,177 | 6 | 6.3 | 5.7 | 104.2 |
| 20-24 | 4,067,709 | 2,073,779 | 1,993,930 | 6.1 | 6.3 | 5.8 | 104 |
| 25-29 | 3,925,724 | 2,000,354 | 1,925,370 | 5.9 | 6.1 | 5.6 | 103.9 |
| 30-34 | 3,776,510 | 1,893,439 | 1,883,071 | 5.6 | 5.8 | 5.5 | 100.6 |
| 35-39 | 3,990,611 | 1,982,028 | 2,008,583 | 6 | 6.1 | 5.9 | 98.7 |
| 40-44 | 4,036,149 | 1,999,899 | 2,036,250 | 6 | 6.1 | 5.9 | 98.2 |
| 45-49 | 3,872,589 | 1,916,901 | 1,955,688 | 5.8 | 5.9 | 5.7 | 98 |
| 50-54 | 4,273,493 | 2,105,940 | 2,167,553 | 6.4 | 6.4 | 6.3 | 97.2 |
| 55-59 | 4,174,031 | 2,036,077 | 2,137,954 | 6.2 | 6.2 | 6.2 | 95.2 |
| 60-64 | 4,108,902 | 1,984,086 | 2,124,816 | 6.1 | 6.1 | 6.2 | 93.4 |
| 65-69 | 3,813,131 | 1,804,027 | 2,009,104 | 5.7 | 5.5 | 5.9 | 89.8 |
| 70-74 | 3,581,181 | 1,665,725 | 1,915,456 | 5.4 | 5.1 | 5.6 | 87 |
| 75-79 | 3,270,650 | 1,489,959 | 1,780,691 | 4.9 | 4.6 | 5.2 | 83.7 |
| 80-84 | 1,880,603 | 827,971 | 1,052,632 | 2.8 | 2.5 | 3.1 | 78.7 |
| 85-89 | 1,360,261 | 528,173 | 832,088 | 2 | 1.6 | 2.4 | 63.5 |
| 90-94 | 767,690 | 244,609 | 523,081 | 1.1 | 0.7 | 1.5 | 46.8 |
| 95-99 | 245,434 | 59,590 | 185,844 | 0.4 | 0.2 | 0.5 | 32.1 |
| 100+ | 42,215 | 7,428 | 34,787 | 0.1 | 0 | 0.1 | 21.4 |
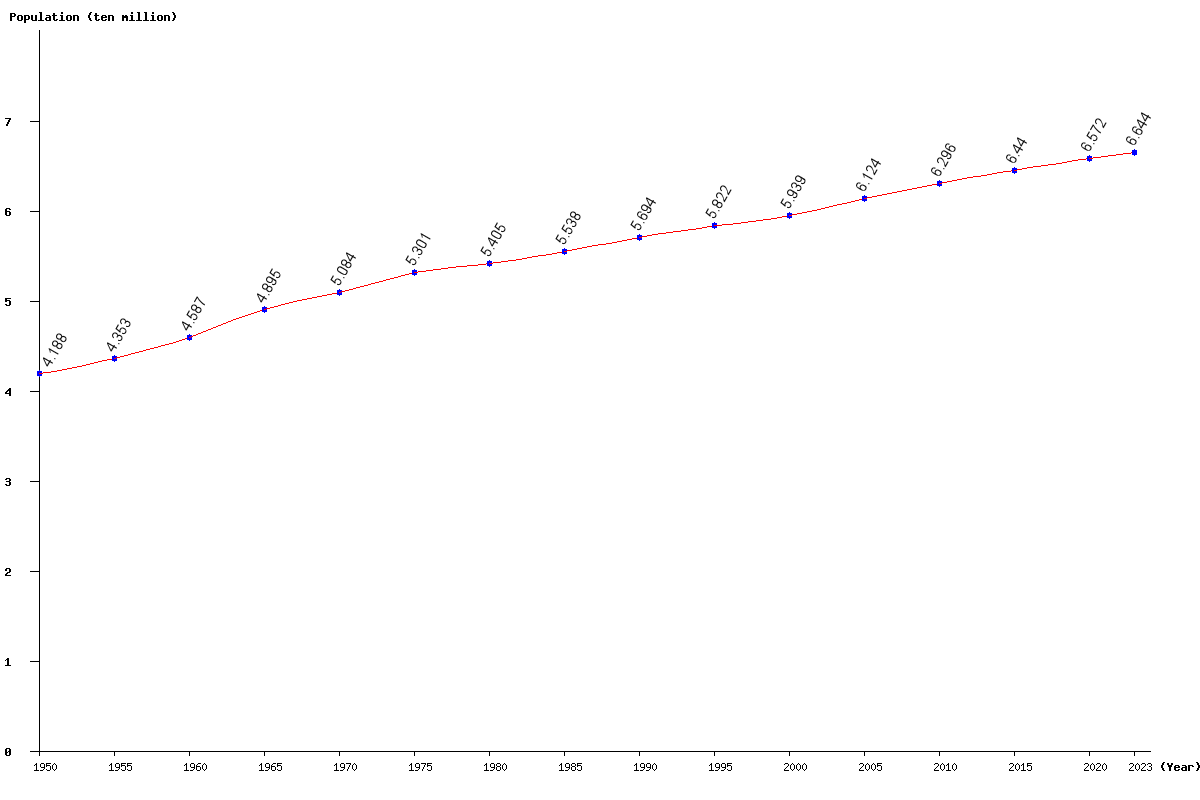
| Year | Population | Yearly % Change |
Yearly Change |
Sex ratio | Density (P/Km²) |
|---|---|---|---|---|---|
| 2025 | 66,895,621 | 0.34 | 228,030 | 95.41 | 122.17 |
| 2024 | 66,667,591 | 0.35 | 229,954 | 95.37 | 121.75 |
| 2023 | 66,437,637 | 0.35 | 233,350 | 95.33 | 121.33 |
| 2022 | 66,204,287 | 0.36 | 238,730 | 95.28 | 120.91 |
| 2021 | 65,965,557 | 0.37 | 245,527 | 95.22 | 120.47 |
| 2020 | 65,720,030 | 0.39 | 253,395 | 95.15 | 120.02 |
| 2019 | 65,466,635 | 0.40 | 260,964 | 95.08 | 119.56 |
| 2018 | 65,205,671 | 0.41 | 266,955 | 95.00 | 119.08 |
| 2017 | 64,938,716 | 0.42 | 270,587 | 94.92 | 118.60 |
| 2016 | 64,668,129 | 0.42 | 272,784 | 94.85 | 118.10 |
| 2015 | 64,395,345 | 0.43 | 274,096 | 94.82 | 117.60 |
| 2014 | 64,121,249 | 0.43 | 276,720 | 94.82 | 117.10 |
| 2013 | 63,844,529 | 0.44 | 282,731 | 94.85 | 116.60 |
| 2012 | 63,561,798 | 0.46 | 293,393 | 94.90 | 116.08 |
| 2011 | 63,268,405 | 0.49 | 307,269 | 94.96 | 115.55 |
| 2010 | 62,961,136 | 0.51 | 320,235 | 95.01 | 114.99 |
| 2005 | 61,241,700 | 3.12 | 1,854,517 | 95.30 | 111.85 |
| 2000 | 59,387,183 | 2.00 | 1,163,132 | 95.74 | 108.46 |
| 1995 | 58,224,051 | 2.25 | 1,280,752 | 96.10 | 106.33 |
| 1990 | 56,943,299 | 2.82 | 1,563,376 | 96.47 | 104.00 |
| 1985 | 55,379,923 | 2.45 | 1,326,699 | 96.76 | 101.14 |
| 1980 | 54,053,224 | 1.97 | 1,042,497 | 97.21 | 98.72 |
| 1975 | 53,010,727 | 4.26 | 2,166,897 | 97.28 | 96.81 |
| 1970 | 50,843,830 | 3.86 | 1,891,547 | 96.63 | 92.86 |
| 1965 | 48,952,283 | 6.73 | 3,086,584 | 95.76 | 89.40 |
| 1960 | 45,865,699 | 5.37 | 2,337,634 | 94.70 | 83.76 |
| 1955 | 43,528,065 | 3.94 | 1,648,458 | 93.78 | 79.50 |
| 1950 | 41,879,607 | 92.63 | 76.48 |