Ethiopia population
10,237,404
Births this year: 0
Births today 0
Deaths this year 0
Deaths today 0
10,237,404
| Region Name | Percents | Number |
|---|---|---|
| Ethiopian Orthodox | 43.5% | 4,453,271 people |
| Muslim | 33.9% | 3,470,480 people |
| Protestant | 18.5% | 1,893,920 people |
| traditional | 2.7% | 276,410 people |
| Catholic | 0.7% | 71,662 people |
| other | 0.6% | 61,424 people |
| Ethnic groups Name | Percents | Number |
|---|---|---|
| Oromo | 34.4% | 3,521,667 people |
| Amhara (Amara) | 27% | 2,764,099 people |
| Somali (Somalie) | 6.2% | 634,719 people |
| Tigray (Tigrinya) | 6.1% | 624,482 people |
| Sidama | 4% | 409,496 people |
| Gurage | 2.5% | 255,935 people |
| Welaita | 2.3% | 235,460 people |
| Hadiya | 1.7% | 174,036 people |
| Afar (Affar) | 1.7% | 174,036 people |
| Gamo | 1.5% | 153,561 people |
| Gedeo | 1.3% | 133,086 people |
| Silte | 1.3% | 133,086 people |
| Kefficho | 1.2% | 122,849 people |
| other | 10.5% | 1,074,927 people |
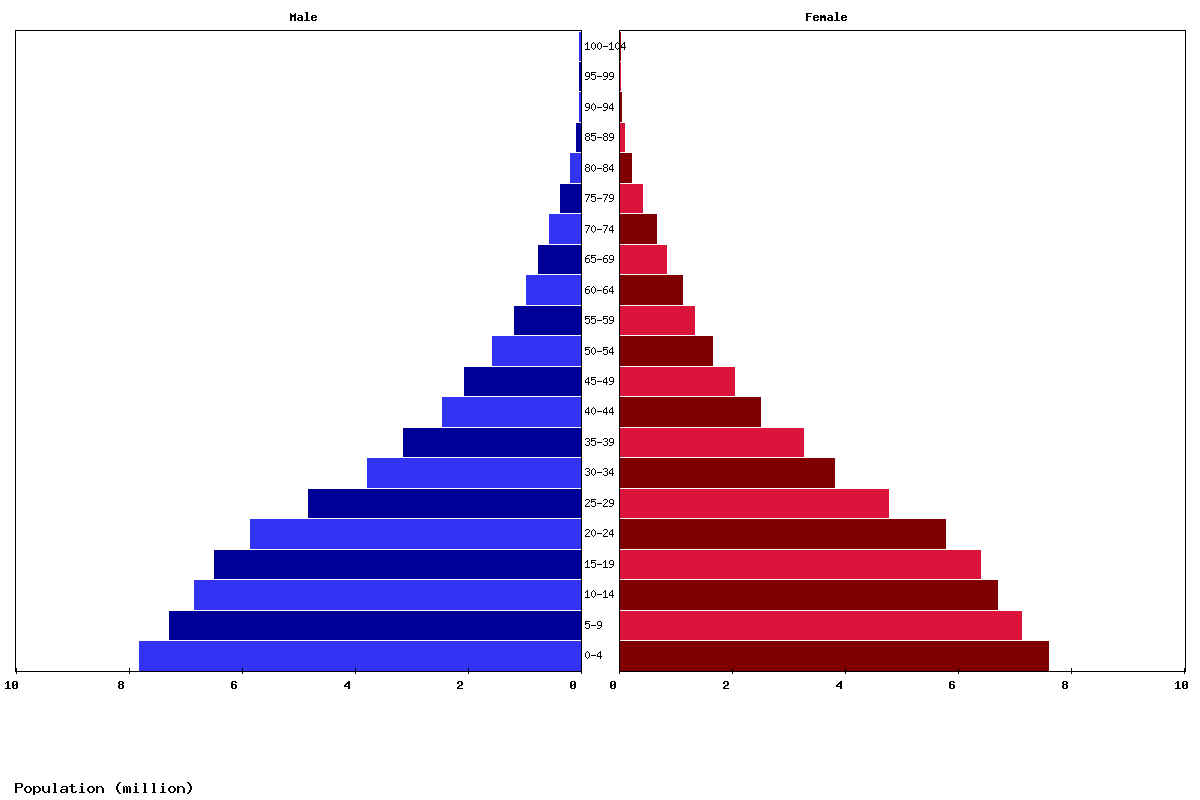
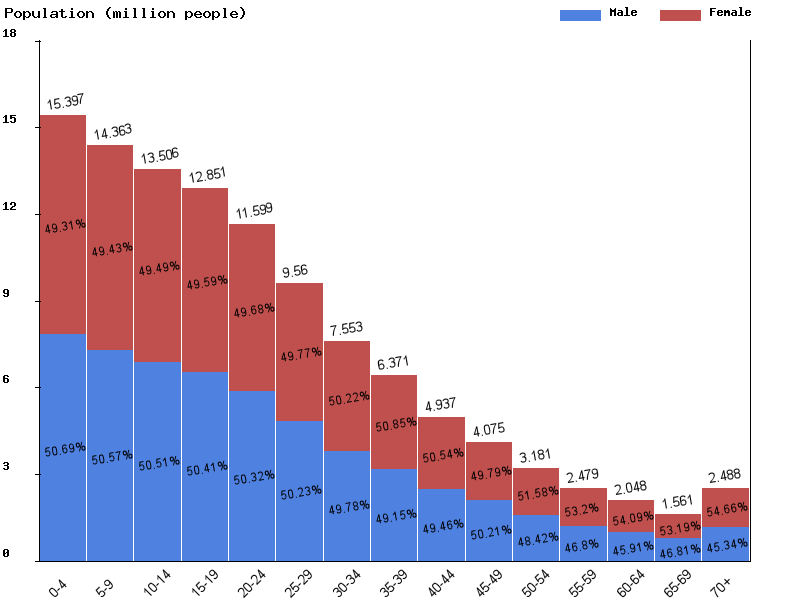
| Age | Both Sexes Population | Male Population | Female Population | Both Sexes (%) | Male (%) | Female (%) | Sex ratio (female/male) |
|---|---|---|---|---|---|---|---|
| Total | 125,043,752 | 62,411,370 | 62,632,382 | 100 | 100 | 100 | 99.6 |
| 00-04 | 16,015,985 | 8,119,092 | 7,896,893 | 12.8 | 13 | 12.6 | 102.8 |
| 05-09 | 15,203,446 | 7,689,494 | 7,513,952 | 12.2 | 12.3 | 12 | 102.3 |
| 10-14 | 14,277,176 | 7,212,965 | 7,064,211 | 11.4 | 11.6 | 11.3 | 102.1 |
| 15-19 | 13,405,315 | 6,762,073 | 6,643,242 | 10.7 | 10.8 | 10.6 | 101.8 |
| 20-24 | 12,704,961 | 6,385,391 | 6,319,570 | 10.2 | 10.2 | 10.1 | 101 |
| 25-29 | 11,445,237 | 5,741,422 | 5,703,815 | 9.2 | 9.2 | 9.1 | 100.7 |
| 30-34 | 9,424,441 | 4,720,179 | 4,704,262 | 7.5 | 7.6 | 7.5 | 100.3 |
| 35-39 | 7,434,650 | 3,690,529 | 3,744,121 | 5.9 | 5.9 | 6 | 98.6 |
| 40-44 | 6,245,677 | 3,062,125 | 3,183,552 | 5 | 4.9 | 5.1 | 96.2 |
| 45-49 | 4,811,099 | 2,373,099 | 2,438,000 | 3.8 | 3.8 | 3.9 | 97.3 |
| 50-54 | 3,934,801 | 1,966,363 | 1,968,438 | 3.1 | 3.2 | 3.1 | 99.9 |
| 55-59 | 3,038,259 | 1,460,584 | 1,577,675 | 2.4 | 2.3 | 2.5 | 92.6 |
| 60-64 | 2,324,092 | 1,075,950 | 1,248,142 | 1.9 | 1.7 | 2 | 86.2 |
| 65-69 | 1,849,018 | 836,034 | 1,012,984 | 1.5 | 1.3 | 1.6 | 82.5 |
| 70-74 | 1,323,034 | 608,050 | 714,984 | 1.1 | 1 | 1.1 | 85 |
| 75-79 | 902,947 | 399,512 | 503,435 | 0.7 | 0.6 | 0.8 | 79.4 |
| 80-84 | 470,255 | 208,852 | 261,403 | 0.4 | 0.3 | 0.4 | 79.9 |
| 85-89 | 177,639 | 77,021 | 100,618 | 0.1 | 0.1 | 0.2 | 76.5 |
| 90-94 | 48,130 | 19,842 | 28,288 | 0 | 0 | 0 | 70.1 |
| 95-99 | 7,072 | 2,635 | 4,437 | 0 | 0 | 0 | 59.4 |
| 100+ | 518 | 158 | 360 | 0 | 0 | 0 | 43.9 |
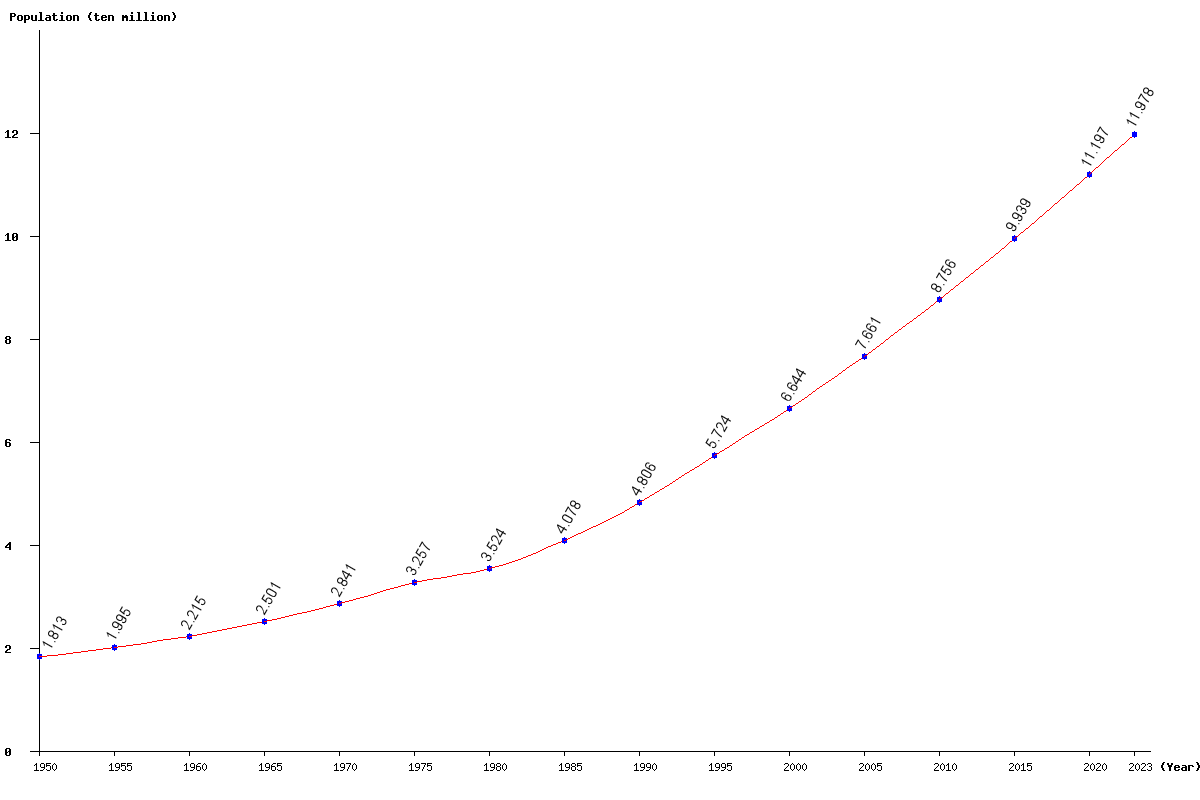
| Year | Population | Yearly % Change |
Yearly Change |
Sex ratio | Density (P/Km²) |
|---|---|---|---|---|---|
| 2025 | 125,043,752 | 2.16 | 2,638,955 | 99.65 | 125.04 |
| 2024 | 122,404,797 | 2.20 | 2,629,538 | 99.65 | 122.40 |
| 2023 | 119,775,259 | 2.23 | 2,617,364 | 99.65 | 119.78 |
| 2022 | 117,157,895 | 2.27 | 2,602,300 | 99.65 | 117.16 |
| 2021 | 114,555,595 | 2.31 | 2,584,544 | 99.65 | 114.56 |
| 2020 | 111,971,051 | 2.34 | 2,564,723 | 99.65 | 111.97 |
| 2019 | 109,406,328 | 2.38 | 2,542,886 | 99.65 | 109.41 |
| 2018 | 106,863,442 | 2.41 | 2,518,541 | 99.65 | 106.86 |
| 2017 | 104,344,901 | 2.45 | 2,491,633 | 99.65 | 104.34 |
| 2016 | 101,853,268 | 2.48 | 2,462,518 | 99.65 | 101.85 |
| 2015 | 99,390,750 | 2.51 | 2,432,018 | 99.65 | 99.39 |
| 2014 | 96,958,732 | 2.54 | 2,400,358 | 99.64 | 96.96 |
| 2013 | 94,558,374 | 2.57 | 2,367,163 | 99.64 | 94.56 |
| 2012 | 92,191,211 | 2.60 | 2,332,515 | 99.64 | 92.19 |
| 2011 | 89,858,696 | 2.62 | 2,296,882 | 99.63 | 89.86 |
| 2010 | 87,561,814 | 2.65 | 2,259,715 | 99.62 | 87.56 |
| 2005 | 76,608,431 | 15.30 | 10,164,828 | 99.54 | 76.61 |
| 2000 | 66,443,603 | 16.08 | 9,206,377 | 99.45 | 66.44 |
| 1995 | 57,237,226 | 19.10 | 9,180,132 | 99.42 | 57.24 |
| 1990 | 48,057,094 | 17.86 | 7,281,097 | 99.48 | 48.06 |
| 1985 | 40,775,997 | 15.71 | 5,536,023 | 99.13 | 40.78 |
| 1980 | 35,239,974 | 8.20 | 2,671,435 | 99.11 | 35.24 |
| 1975 | 32,568,539 | 14.62 | 4,153,540 | 99.15 | 32.57 |
| 1970 | 28,414,999 | 13.60 | 3,401,448 | 99.04 | 28.41 |
| 1965 | 25,013,551 | 12.92 | 2,862,333 | 98.93 | 25.01 |
| 1960 | 22,151,218 | 11.05 | 2,203,953 | 98.84 | 22.15 |
| 1955 | 19,947,265 | 10.04 | 1,819,231 | 98.70 | 19.95 |
| 1950 | 18,128,034 | 98.56 | 18.13 |