East Timor population
1,612,166
Births this year: 426,870
Births today 44
Deaths this year 75,776
Deaths today 8
1,612,166
| Region Name | Percents | Number |
|---|---|---|
| Roman Catholic | 96.9% | 1,221,979 people |
| Protestant / Evangelical | 2.2% | 27,744 people |
| Muslim 0.3, other 0.6 | 30.6% | 385,888 people |
| Ethnic groups Name | Percents | Number |
|---|---|---|
| Austronesian (Malayo-Polynesian), Papuan, small Chinese minority | 100% | 1,261,072 people |
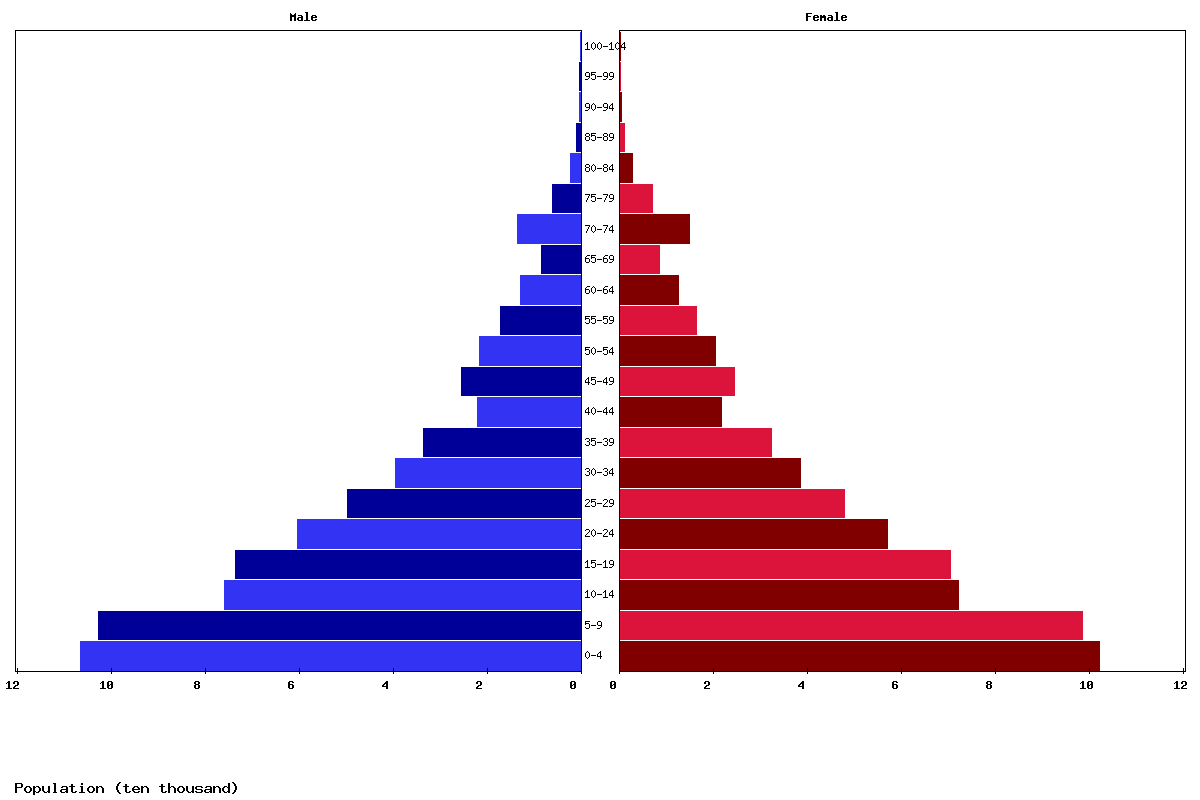
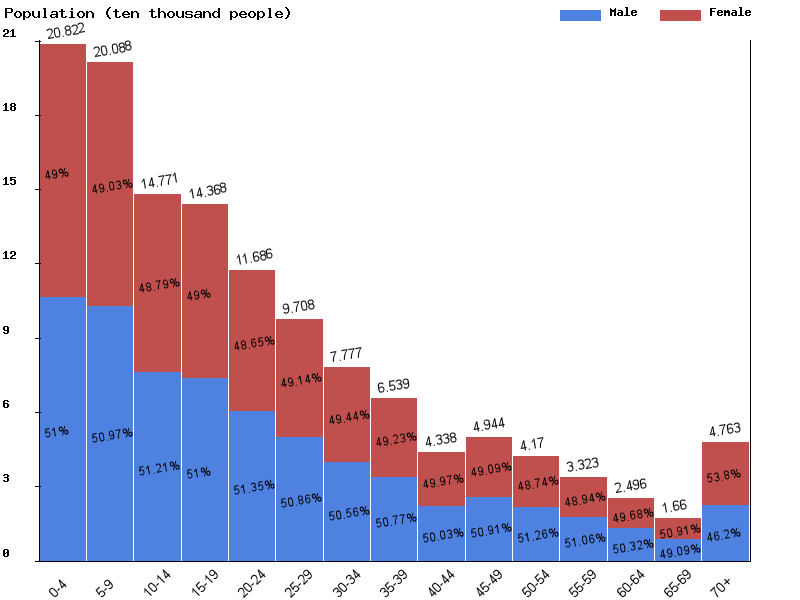
| Age | Both Sexes Population | Male Population | Female Population | Both Sexes (%) | Male (%) | Female (%) | Sex ratio (female/male) |
|---|---|---|---|---|---|---|---|
| Total | 1,445,481 | 733,673 | 711,808 | 100 | 100 | 100 | 103.1 |
| 00-04 | 211,419 | 107,816 | 103,603 | 14.6 | 14.7 | 14.6 | 104.1 |
| 05-09 | 205,643 | 104,805 | 100,838 | 14.2 | 14.3 | 14.2 | 103.9 |
| 10-14 | 199,345 | 101,583 | 97,762 | 13.8 | 13.8 | 13.7 | 103.9 |
| 15-19 | 141,918 | 72,690 | 69,228 | 9.8 | 9.9 | 9.7 | 105 |
| 20-24 | 133,344 | 68,021 | 65,323 | 9.2 | 9.3 | 9.2 | 104.1 |
| 25-29 | 106,988 | 54,992 | 51,996 | 7.4 | 7.5 | 7.3 | 105.8 |
| 30-34 | 89,565 | 45,562 | 44,003 | 6.2 | 6.2 | 6.2 | 103.5 |
| 35-39 | 72,434 | 36,600 | 35,834 | 5 | 5 | 5 | 102.1 |
| 40-44 | 61,573 | 31,224 | 30,349 | 4.3 | 4.3 | 4.3 | 102.9 |
| 45-49 | 40,643 | 20,271 | 20,372 | 2.8 | 2.8 | 2.9 | 99.5 |
| 50-54 | 46,911 | 23,778 | 23,133 | 3.2 | 3.2 | 3.2 | 102.8 |
| 55-59 | 39,157 | 19,946 | 19,211 | 2.7 | 2.7 | 2.7 | 103.8 |
| 60-64 | 30,473 | 15,403 | 15,070 | 2.1 | 2.1 | 2.1 | 102.2 |
| 65-69 | 21,965 | 10,859 | 11,106 | 1.5 | 1.5 | 1.6 | 97.8 |
| 70-74 | 13,550 | 6,477 | 7,073 | 0.9 | 0.9 | 1 | 91.6 |
| 75-79 | 20,408 | 9,375 | 11,033 | 1.4 | 1.3 | 1.5 | 85 |
| 80-84 | 7,507 | 3,252 | 4,255 | 0.5 | 0.4 | 0.6 | 76.4 |
| 85-89 | 2,101 | 827 | 1,274 | 0.1 | 0.1 | 0.2 | 64.9 |
| 90-94 | 467 | 169 | 298 | 0 | 0 | 0 | 56.7 |
| 95-99 | 67 | 22 | 45 | 0 | 0 | 0 | 48.9 |
| 100+ | 3 | 1 | 2 | 0 | 0 | 0 | 50 |
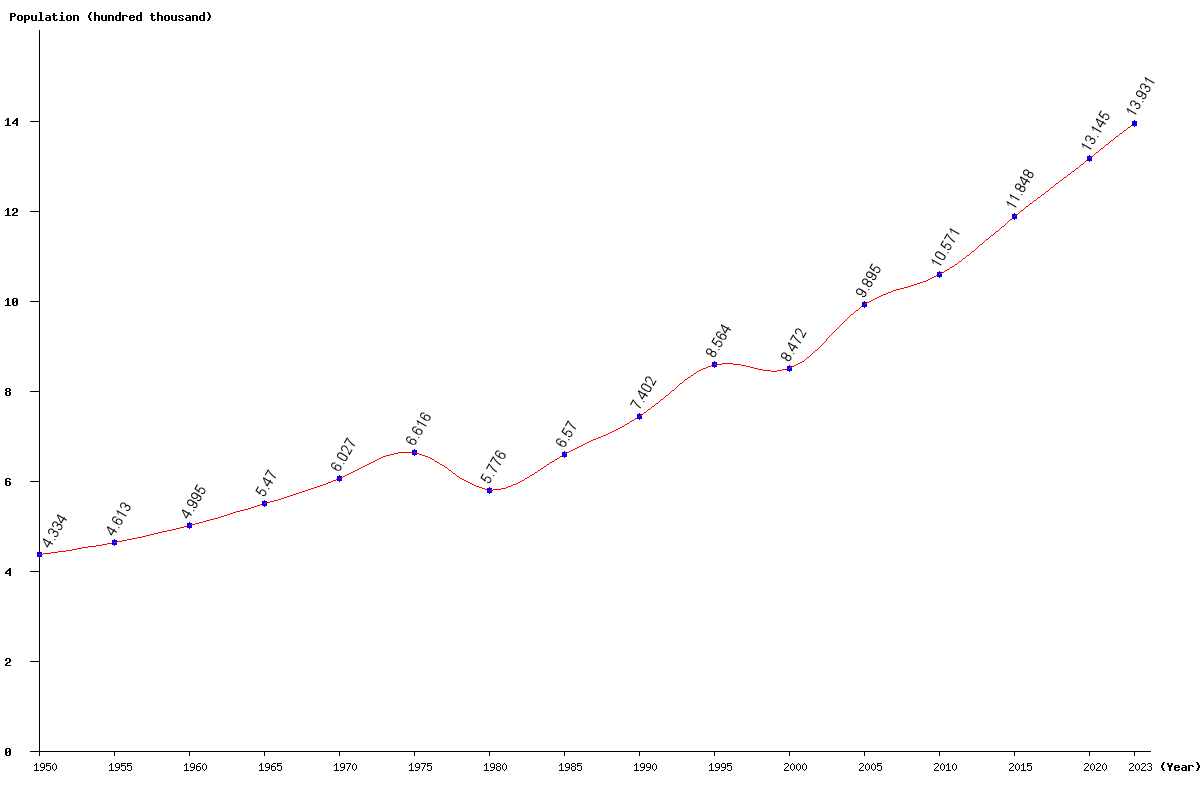
| Year | Population | Yearly % Change |
Yearly Change |
Sex ratio | Density (P/Km²) |
|---|---|---|---|---|---|
| 2025 | 1,445,481 | 1.84 | 26,185 | 103.07 | 97.21 |
| 2024 | 1,419,296 | 1.88 | 26,212 | 103.08 | 95.45 |
| 2023 | 1,393,084 | 1.92 | 26,220 | 103.09 | 93.68 |
| 2022 | 1,366,864 | 1.95 | 26,193 | 103.09 | 91.92 |
| 2021 | 1,340,671 | 1.99 | 26,138 | 103.10 | 90.16 |
| 2020 | 1,314,533 | 2.01 | 25,925 | 103.11 | 88.40 |
| 2019 | 1,288,608 | 2.03 | 25,681 | 103.12 | 86.66 |
| 2018 | 1,262,927 | 2.08 | 25,676 | 103.12 | 84.93 |
| 2017 | 1,237,251 | 2.15 | 26,006 | 103.13 | 83.20 |
| 2016 | 1,211,245 | 2.24 | 26,480 | 103.14 | 81.46 |
| 2015 | 1,184,765 | 2.37 | 27,405 | 103.15 | 79.67 |
| 2014 | 1,157,360 | 2.48 | 28,045 | 103.17 | 77.83 |
| 2013 | 1,129,315 | 2.47 | 27,239 | 103.19 | 75.95 |
| 2012 | 1,102,076 | 2.27 | 24,474 | 103.21 | 74.11 |
| 2011 | 1,077,602 | 1.94 | 20,480 | 103.22 | 72.47 |
| 2010 | 1,057,122 | 1.47 | 15,295 | 103.20 | 71.09 |
| 2005 | 989,497 | 16.80 | 142,312 | 102.82 | 66.54 |
| 2000 | 847,185 | -1.08 | -9,254 | 102.86 | 56.97 |
| 1995 | 856,439 | 15.70 | 116,208 | 102.18 | 57.60 |
| 1990 | 740,231 | 12.67 | 83,213 | 102.38 | 49.78 |
| 1985 | 657,018 | 13.75 | 79,438 | 102.74 | 44.18 |
| 1980 | 577,580 | -12.70 | -84,054 | 102.74 | 38.84 |
| 1975 | 661,634 | 9.77 | 58,897 | 103.10 | 44.49 |
| 1970 | 602,737 | 10.18 | 55,702 | 103.18 | 40.53 |
| 1965 | 547,035 | 9.51 | 47,510 | 103.13 | 36.79 |
| 1960 | 499,525 | 8.30 | 38,268 | 103.02 | 33.59 |
| 1955 | 461,257 | 6.43 | 27,859 | 102.88 | 31.02 |
| 1950 | 433,398 | 102.52 | 29.15 |