Dominica population
79,149
Births this year: 11,228
Births today 1
Deaths this year 5,835
Deaths today 1
79,149
| Region Name | Percents | Number |
|---|---|---|
| Roman Catholic | 61.4% | 45,287 people |
| Protestant (Seventh-Day Adventist, Pentecostal, Baptist, Methodist, Church of God) | 20.6% | 15,194 people |
| other | 18% | 13,276 people |
| Ethnic groups Name | Percents | Number |
|---|---|---|
| black | 86.8% | 64,021 people |
| mixed | 8.9% | 6,564 people |
| Carib Amerindian | 2.9% | 2,139 people |
| white | 0.8% | 590 people |
| other | 0.7% | 516 people |
| Year | Population | Yearly % Change |
Yearly Change |
Sex ratio | Density (P/Km²) |
|---|---|---|---|---|---|
| 2025 | 75,640 | 0.29 | 215 | 98.60 | 100.85 |
| 2024 | 75,425 | 0.32 | 244 | 98.53 | 100.57 |
| 2023 | 75,181 | 0.36 | 267 | 98.45 | 100.24 |
| 2022 | 74,914 | 0.39 | 288 | 98.37 | 99.89 |
| 2021 | 74,626 | 0.41 | 303 | 98.29 | 99.50 |
| 2020 | 74,323 | 0.43 | 316 | 98.20 | 99.10 |
| 2019 | 74,007 | 0.44 | 324 | 98.10 | 98.68 |
| 2018 | 73,683 | 0.45 | 330 | 97.99 | 98.24 |
| 2017 | 73,353 | 0.46 | 337 | 97.89 | 97.80 |
| 2016 | 73,016 | 0.46 | 336 | 97.77 | 97.35 |
| 2015 | 72,680 | 0.47 | 339 | 97.66 | 96.91 |
| 2014 | 72,341 | 0.47 | 336 | 97.55 | 96.45 |
| 2013 | 72,005 | 0.45 | 320 | 97.44 | 96.01 |
| 2012 | 71,685 | 0.40 | 283 | 97.32 | 95.58 |
| 2011 | 71,402 | 0.33 | 235 | 97.20 | 95.20 |
| 2010 | 71,167 | 0.24 | 172 | 97.07 | 94.89 |
| 2005 | 70,542 | 1.24 | 863 | 96.35 | 94.06 |
| 2000 | 69,679 | -2.37 | -1,688 | 95.63 | 92.91 |
| 1995 | 71,367 | 0.62 | 439 | 95.43 | 95.16 |
| 1990 | 70,928 | -3.68 | -2,712 | 97.35 | 94.57 |
| 1985 | 73,640 | -2.22 | -1,673 | 97.69 | 98.19 |
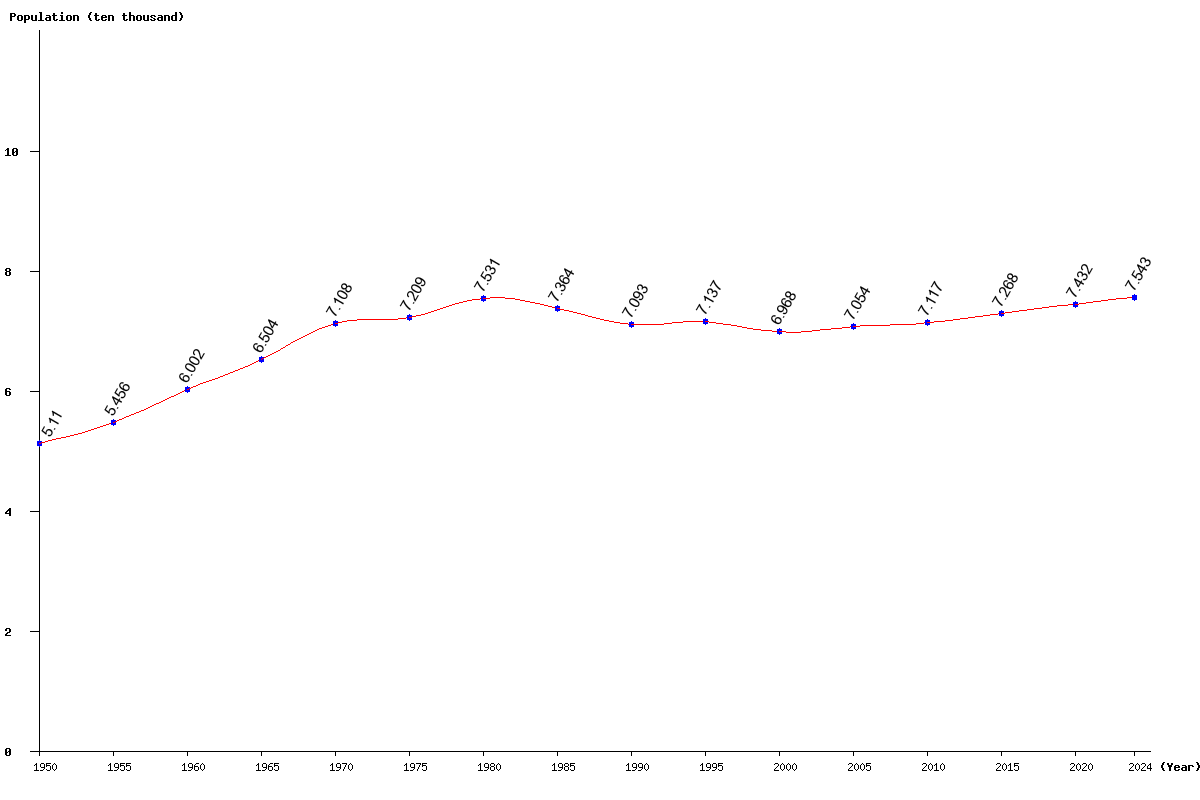
| 1980 | 75,313 | 4.47 | 3,222 | 97.61 | 100.42 |
| 1975 | 72,091 | 1.43 | 1,015 | 97.52 | 96.12 |
| 1970 | 71,076 | 9.28 | 6,038 | 97.42 | 94.77 |
| 1965 | 65,038 | 8.37 | 5,022 | 97.27 | 86.72 |
| 1960 | 60,016 | 10.01 | 5,459 | 97.14 | 80.02 |
| 1955 | 54,557 | 6.76 | 3,456 | 97.06 | 72.74 |
| 1950 | 51,101 | 97.18 | 68.13 |