Burkina Faso population
1,892,434
Births this year: 0
Births today 0
Deaths this year 58,819
Deaths today 6
1,892,434
| Region Name | Percents | Number |
|---|---|---|
| Muslim | 60.5% | 1,180,508 people |
| Catholic | 19% | 370,738 people |
| animist | 15.3% | 298,542 people |
| Protestant | 4.2% | 81,953 people |
| other | 0.6% | 11,708 people |
| none | 0.4% | 7,805 people |
| Ethnic groups Name | Percents | Number |
|---|---|---|
| Mossi over | 40% | 780,501 people |
| other approximately (includes Gurunsi, Senufo, Lobi, Bobo, Mande, and Fulani) | 60% | 1,170,752 people |
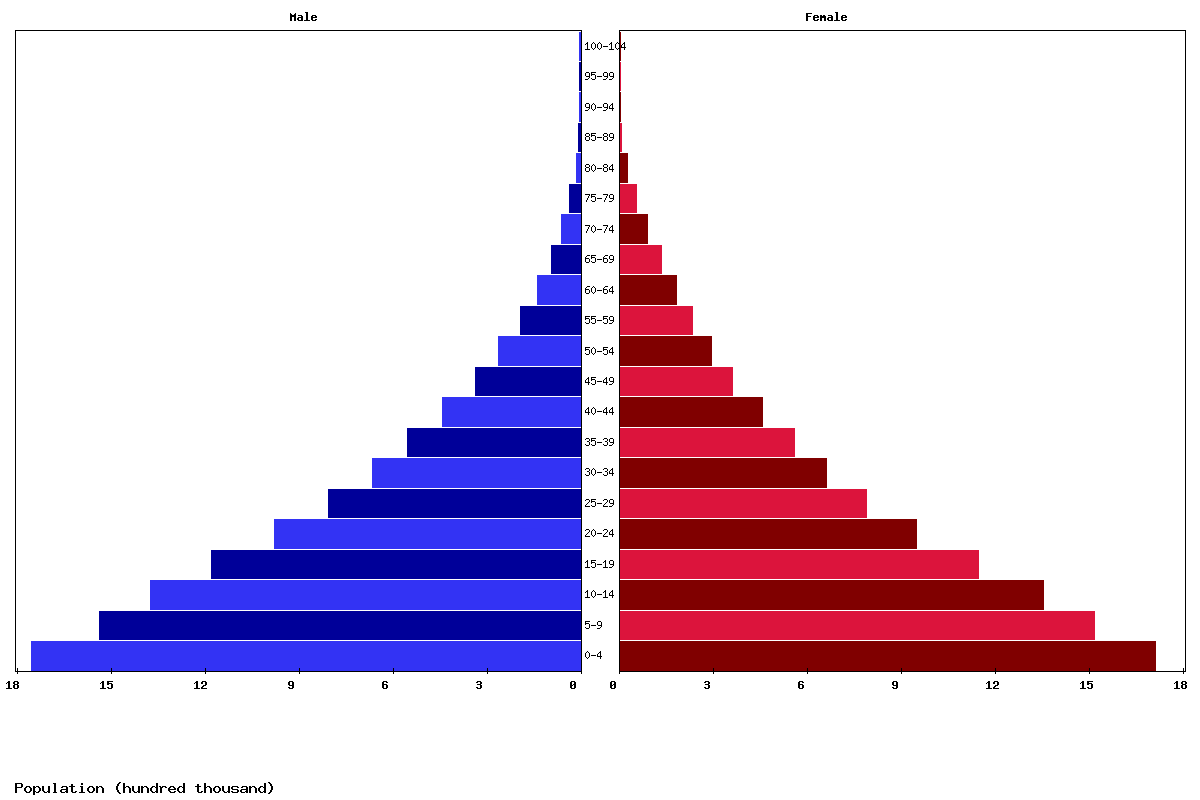
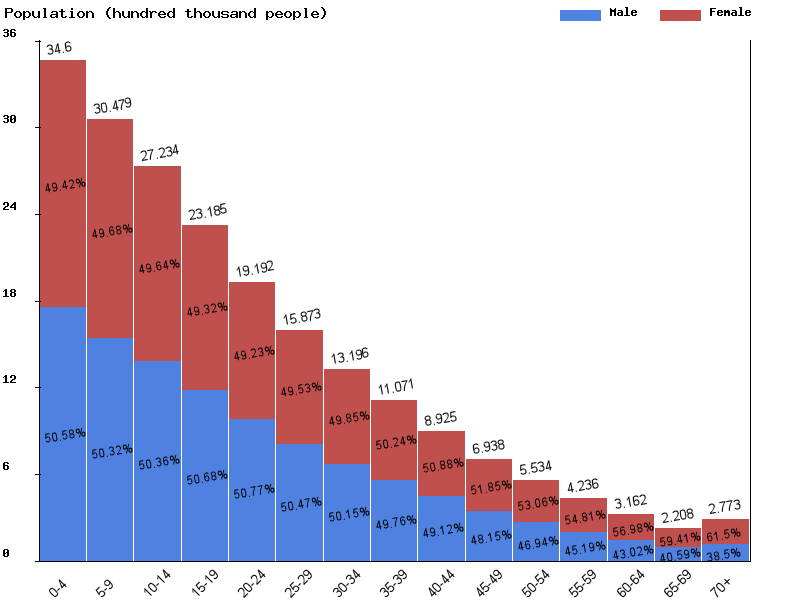
| Age | Both Sexes Population | Male Population | Female Population | Both Sexes (%) | Male (%) | Female (%) | Sex ratio (female/male) |
|---|---|---|---|---|---|---|---|
| Total | 23,903,075 | 11,908,485 | 11,994,590 | 100 | 100 | 100 | 99.3 |
| 00-04 | 3,790,845 | 1,919,307 | 1,871,538 | 15.9 | 16.1 | 15.6 | 102.6 |
| 05-09 | 3,367,921 | 1,696,490 | 1,671,431 | 14.1 | 14.2 | 13.9 | 101.5 |
| 10-14 | 3,015,382 | 1,518,367 | 1,497,015 | 12.6 | 12.8 | 12.5 | 101.4 |
| 15-19 | 2,691,186 | 1,354,995 | 1,336,191 | 11.3 | 11.4 | 11.1 | 101.4 |
| 20-24 | 2,267,715 | 1,146,839 | 1,120,876 | 9.5 | 9.6 | 9.3 | 102.3 |
| 25-29 | 1,863,312 | 942,712 | 920,600 | 7.8 | 7.9 | 7.7 | 102.4 |
| 30-34 | 1,538,517 | 773,772 | 764,745 | 6.4 | 6.5 | 6.4 | 101.2 |
| 35-39 | 1,278,232 | 638,700 | 639,532 | 5.3 | 5.4 | 5.3 | 99.9 |
| 40-44 | 1,070,414 | 530,409 | 540,005 | 4.5 | 4.5 | 4.5 | 98.2 |
| 45-49 | 859,190 | 419,464 | 439,726 | 3.6 | 3.5 | 3.7 | 95.4 |
| 50-54 | 661,532 | 315,802 | 345,730 | 2.8 | 2.7 | 2.9 | 91.3 |
| 55-59 | 518,688 | 240,606 | 278,082 | 2.2 | 2 | 2.3 | 86.5 |
| 60-64 | 384,801 | 171,189 | 213,612 | 1.6 | 1.4 | 1.8 | 80.1 |
| 65-69 | 271,784 | 114,749 | 157,035 | 1.1 | 1 | 1.3 | 73.1 |
| 70-74 | 172,263 | 68,350 | 103,913 | 0.7 | 0.6 | 0.9 | 65.8 |
| 75-79 | 96,195 | 36,978 | 59,217 | 0.4 | 0.3 | 0.5 | 62.4 |
| 80-84 | 41,848 | 15,274 | 26,574 | 0.2 | 0.1 | 0.2 | 57.5 |
| 85-89 | 11,355 | 3,892 | 7,463 | 0 | 0 | 0.1 | 52.2 |
| 90-94 | 1,737 | 544 | 1,193 | 0 | 0 | 0 | 45.6 |
| 95-99 | 149 | 43 | 106 | 0 | 0 | 0 | 40.6 |
| 100+ | 9 | 3 | 6 | 0 | 0 | 0 | 50 |
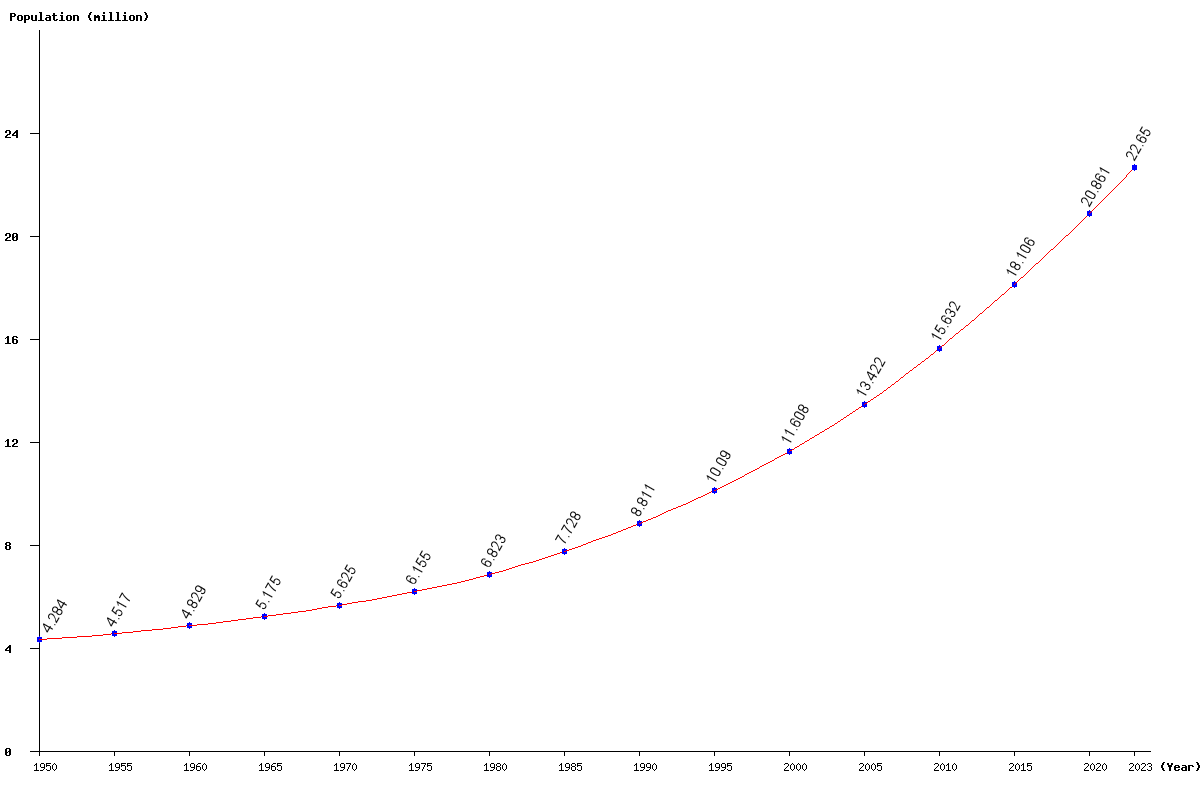
| Year | Population | Yearly % Change |
Yearly Change |
Sex ratio | Density (P/Km²) |
|---|---|---|---|---|---|
| 2025 | 23,903,075 | 2.72 | 632,475 | 99.28 | 87.37 |
| 2024 | 23,270,600 | 2.74 | 620,233 | 99.22 | 85.05 |
| 2023 | 22,650,367 | 2.76 | 608,205 | 99.15 | 82.79 |
| 2022 | 22,042,162 | 2.78 | 596,520 | 99.08 | 80.56 |
| 2021 | 21,445,642 | 2.80 | 585,101 | 99.00 | 78.38 |
| 2020 | 20,860,541 | 2.83 | 573,776 | 98.93 | 76.24 |
| 2019 | 20,286,765 | 2.85 | 562,412 | 98.85 | 74.15 |
| 2018 | 19,724,353 | 2.87 | 551,031 | 98.76 | 72.09 |
| 2017 | 19,173,322 | 2.90 | 539,597 | 98.68 | 70.08 |
| 2016 | 18,633,725 | 2.92 | 528,155 | 98.59 | 68.11 |
| 2015 | 18,105,570 | 2.94 | 516,372 | 98.50 | 66.18 |
| 2014 | 17,589,198 | 2.95 | 504,644 | 98.40 | 64.29 |
| 2013 | 17,084,554 | 2.98 | 493,741 | 98.30 | 62.44 |
| 2012 | 16,590,813 | 3.00 | 483,962 | 98.20 | 60.64 |
| 2011 | 16,106,851 | 3.04 | 474,785 | 98.10 | 58.87 |
| 2010 | 15,632,066 | 3.07 | 466,210 | 97.99 | 57.13 |
| 2005 | 13,421,929 | 15.63 | 1,813,985 | 97.38 | 49.06 |
| 2000 | 11,607,944 | 15.05 | 1,518,068 | 96.54 | 42.43 |
| 1995 | 10,089,876 | 14.51 | 1,278,843 | 96.02 | 36.88 |
| 1990 | 8,811,033 | 14.02 | 1,083,121 | 95.57 | 32.20 |
| 1985 | 7,727,912 | 13.27 | 905,072 | 95.53 | 28.25 |
| 1980 | 6,822,840 | 10.86 | 668,292 | 96.19 | 24.94 |
| 1975 | 6,154,548 | 9.42 | 529,951 | 97.53 | 22.49 |
| 1970 | 5,624,597 | 8.69 | 449,728 | 99.10 | 20.56 |
| 1965 | 5,174,869 | 7.16 | 345,578 | 101.01 | 18.91 |
| 1960 | 4,829,291 | 6.91 | 312,136 | 103.66 | 17.65 |
| 1955 | 4,517,155 | 5.43 | 232,698 | 106.53 | 16.51 |
| 1950 | 4,284,457 | 110.34 | 15.66 |