Bhutan population
827,982
Births this year: 125,000
Births today 22
Deaths this year 47,143
Deaths today 8
827,982
| Region Name | Percents | Number |
|---|---|---|
| Lamaistic Buddhist | 75.3% | 564,844 people |
| Indian- and Nepalese-influenced Hinduism | 22.1% | 165,778 people |
| other | 2.6% | 19,503 people |
| Ethnic groups Name | Percents | Number |
|---|---|---|
| Ngalop (also known as Bhote) | 50% | 375,063 people |
| ethnic Nepalese (includes Lhotsampas - one of several Nepalese ethnic groups) | 35% | 262,544 people |
| indigenous or migrant tribes | 15% | 112,519 people |
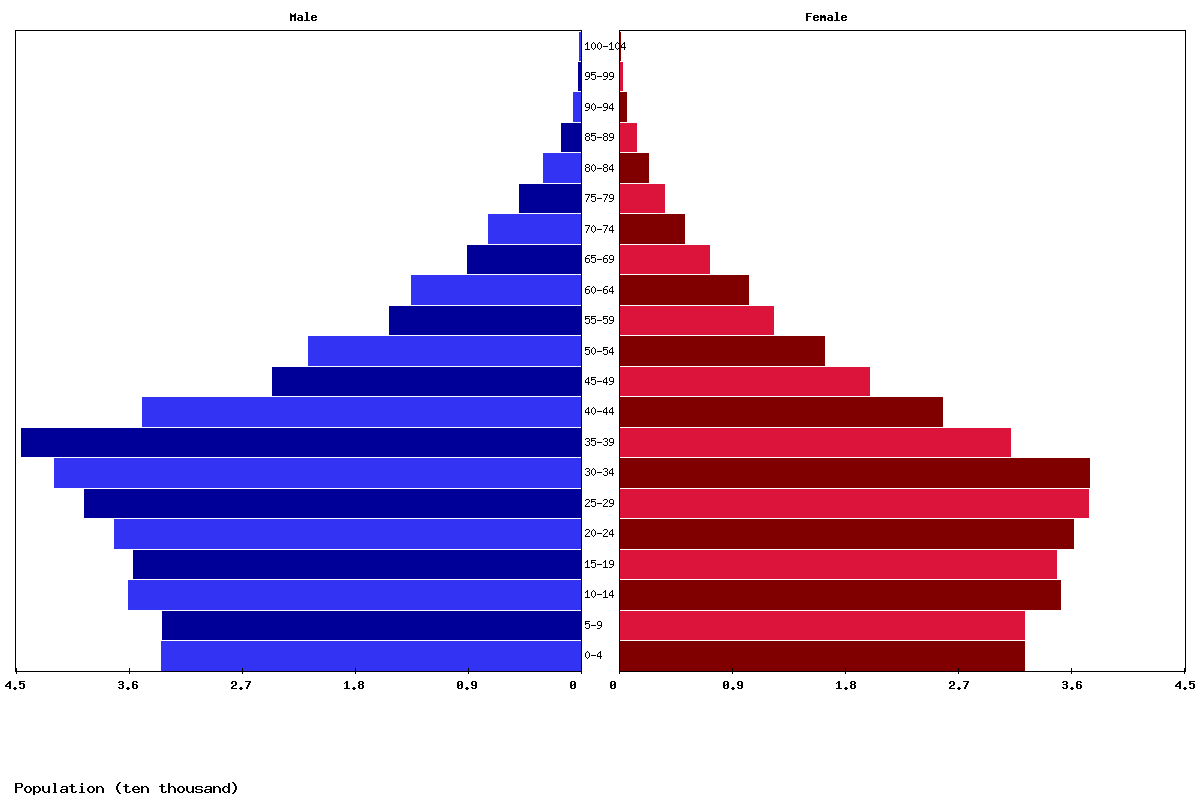
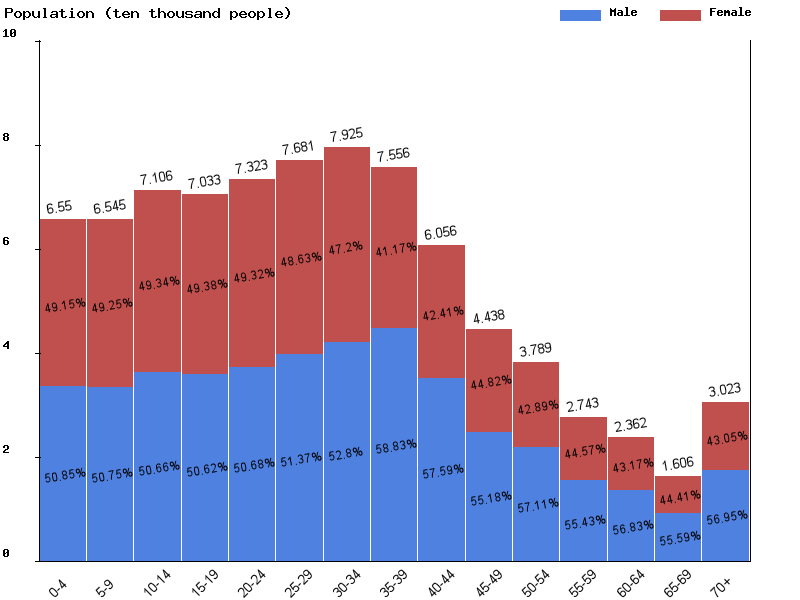
| Age | Both Sexes Population | Male Population | Female Population | Both Sexes (%) | Male (%) | Female (%) | Sex ratio (female/male) |
|---|---|---|---|---|---|---|---|
| Total | 854,841 | 454,450 | 400,391 | 100 | 100 | 100 | 113.5 |
| 00-04 | 62,538 | 31,811 | 30,727 | 7.3 | 7 | 7.7 | 103.5 |
| 05-09 | 65,099 | 33,064 | 32,035 | 7.6 | 7.3 | 8 | 103.2 |
| 10-14 | 65,090 | 32,996 | 32,094 | 7.6 | 7.3 | 8 | 102.8 |
| 15-19 | 70,725 | 35,808 | 34,917 | 8.3 | 7.9 | 8.7 | 102.6 |
| 20-24 | 69,924 | 35,387 | 34,537 | 8.2 | 7.8 | 8.6 | 102.5 |
| 25-29 | 72,647 | 36,801 | 35,846 | 8.5 | 8.1 | 9 | 102.7 |
| 30-34 | 75,956 | 38,976 | 36,980 | 8.9 | 8.6 | 9.2 | 105.4 |
| 35-39 | 78,040 | 41,131 | 36,909 | 9.1 | 9.1 | 9.2 | 111.4 |
| 40-44 | 74,005 | 43,461 | 30,544 | 8.7 | 9.6 | 7.6 | 142.3 |
| 45-49 | 58,917 | 33,879 | 25,038 | 6.9 | 7.5 | 6.3 | 135.3 |
| 50-54 | 42,792 | 23,608 | 19,184 | 5 | 5.2 | 4.8 | 123.1 |
| 55-59 | 36,088 | 20,648 | 15,440 | 4.2 | 4.5 | 3.9 | 133.7 |
| 60-64 | 25,666 | 14,288 | 11,378 | 3 | 3.1 | 2.8 | 125.6 |
| 65-69 | 21,527 | 12,312 | 9,215 | 2.5 | 2.7 | 2.3 | 133.6 |
| 70-74 | 14,042 | 7,867 | 6,175 | 1.6 | 1.7 | 1.5 | 127.4 |
| 75-79 | 10,168 | 5,998 | 4,170 | 1.2 | 1.3 | 1 | 143.8 |
| 80-84 | 6,252 | 3,593 | 2,659 | 0.7 | 0.8 | 0.7 | 135.1 |
| 85-89 | 3,341 | 1,851 | 1,490 | 0.4 | 0.4 | 0.4 | 124.2 |
| 90-94 | 1,482 | 746 | 736 | 0.2 | 0.2 | 0.2 | 101.4 |
| 95-99 | 445 | 193 | 252 | 0.1 | 0 | 0.1 | 76.6 |
| 100+ | 97 | 32 | 65 | 0 | 0 | 0 | 49.2 |
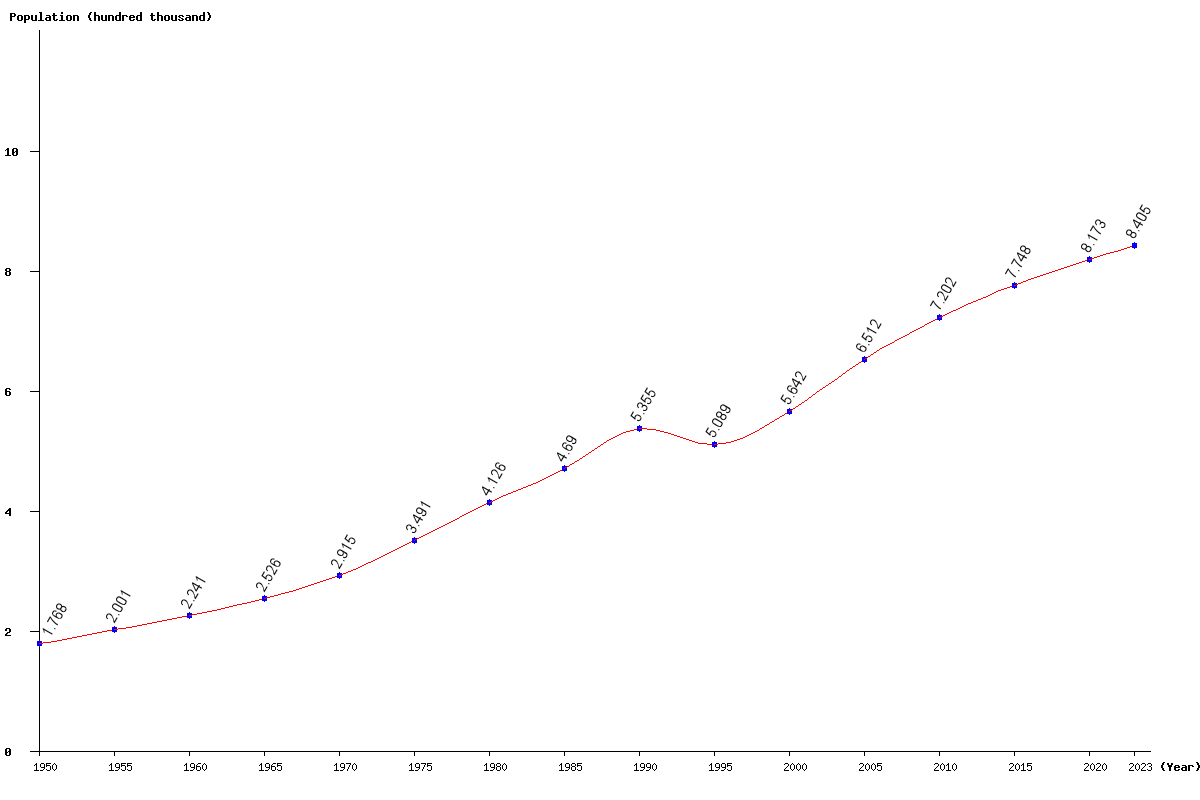
| Year | Population | Yearly % Change |
Yearly Change |
Sex ratio | Density (P/Km²) |
|---|---|---|---|---|---|
| 2025 | 854,841 | 0.83 | 7,041 | 113.50 | 22.43 |
| 2024 | 847,800 | 0.87 | 7,326 | 113.74 | 22.24 |
| 2023 | 840,474 | 0.91 | 7,561 | 113.98 | 22.05 |
| 2022 | 832,913 | 0.94 | 7,724 | 114.23 | 21.85 |
| 2021 | 825,189 | 0.96 | 7,850 | 114.48 | 21.65 |
| 2020 | 817,339 | 0.98 | 7,961 | 114.76 | 21.44 |
| 2019 | 809,378 | 1.01 | 8,121 | 115.06 | 21.23 |
| 2018 | 801,257 | 1.06 | 8,380 | 115.38 | 21.02 |
| 2017 | 792,877 | 1.12 | 8,774 | 115.68 | 20.80 |
| 2016 | 784,103 | 1.20 | 9,273 | 115.93 | 20.57 |
| 2015 | 774,830 | 1.28 | 9,822 | 116.10 | 20.33 |
| 2014 | 765,008 | 1.37 | 10,371 | 116.17 | 20.07 |
| 2013 | 754,637 | 1.47 | 10,926 | 116.13 | 19.80 |
| 2012 | 743,711 | 1.57 | 11,465 | 116.01 | 19.51 |
| 2011 | 732,246 | 1.67 | 12,000 | 115.87 | 19.21 |
| 2010 | 720,246 | 1.75 | 12,416 | 115.72 | 18.90 |
| 2005 | 651,163 | 15.42 | 86,976 | 114.00 | 17.08 |
| 2000 | 564,187 | 10.86 | 55,290 | 105.82 | 14.80 |
| 1995 | 508,897 | -4.97 | -26,608 | 106.31 | 13.35 |
| 1990 | 535,505 | 14.18 | 66,495 | 107.26 | 14.05 |
| 1985 | 469,010 | 13.68 | 56,449 | 107.83 | 12.30 |
| 1980 | 412,561 | 18.16 | 63,415 | 108.57 | 10.82 |
| 1975 | 349,146 | 19.79 | 57,689 | 106.78 | 9.16 |
| 1970 | 291,457 | 15.37 | 38,828 | 103.21 | 7.65 |
| 1965 | 252,629 | 12.73 | 28,521 | 103.25 | 6.63 |
| 1960 | 224,108 | 12.00 | 24,019 | 103.43 | 5.88 |
| 1955 | 200,089 | 13.18 | 23,294 | 103.97 | 5.25 |
| 1950 | 176,795 | 105.24 | 4.64 |