Benin population
1,074,145
Births this year: 0
Births today 0
Deaths this year 0
Deaths today 0
1,074,145
| Region Name | Percents | Number |
|---|---|---|
| Catholic | 27.1% | 291,093 people |
| Muslim | 24.4% | 262,091 people |
| Vodoun | 17.3% | 185,827 people |
| Protestant (Celestial, Methodist, other Protestant ) | 10.4% | 111,711 people |
| other Christian | 5.3% | 56,930 people |
| other | 15.5% | 166,492 people |
| Ethnic groups Name | Percents | Number |
|---|---|---|
| Fon and related | 39.2% | 421,065 people |
| Adja and related | 15.2% | 163,270 people |
| Yoruba and related | 12.3% | 132,120 people |
| Bariba and related | 9.2% | 98,821 people |
| Peulh and related | 7% | 75,190 people |
| Ottamari and related | 6.1% | 65,523 people |
| Yoa-Lokpa and related | 4% | 42,966 people |
| Dendi and related | 2.5% | 26,854 people |
| other (includes Europeans) | 1.6% | 17,186 people |
| unspecified | 2.9% | 31,150 people |
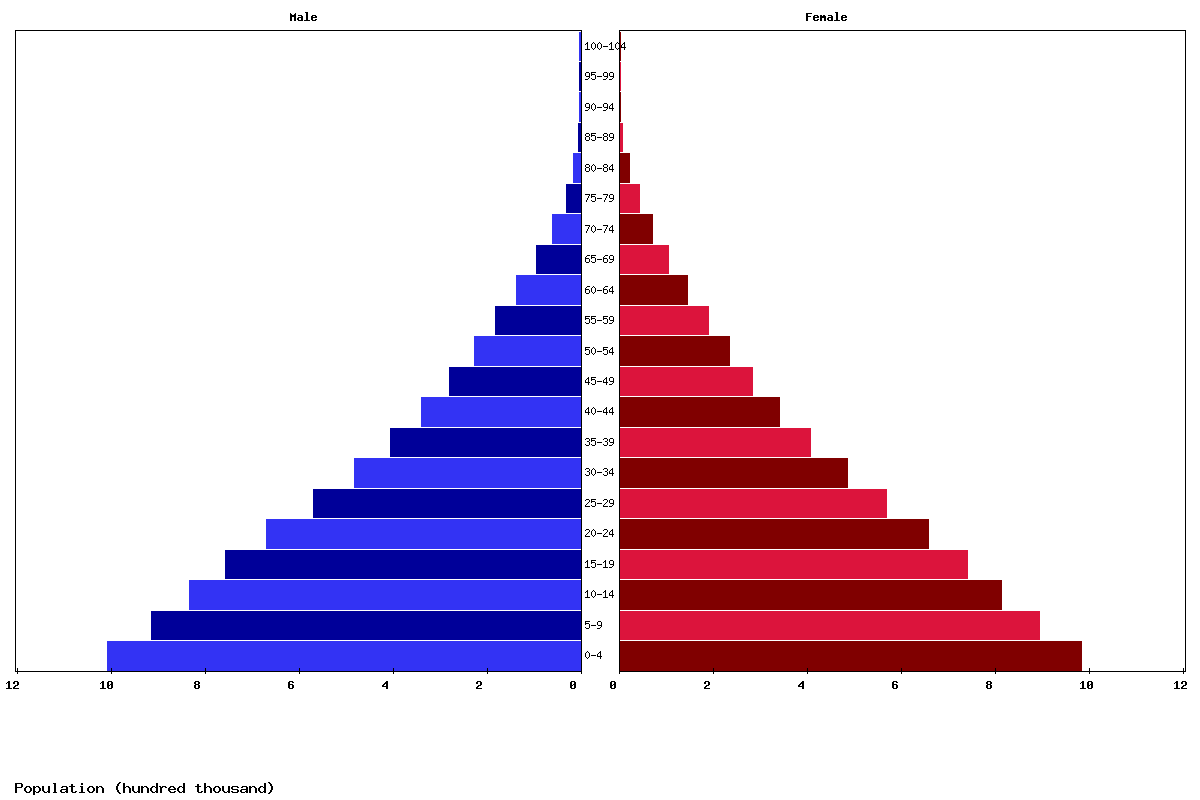
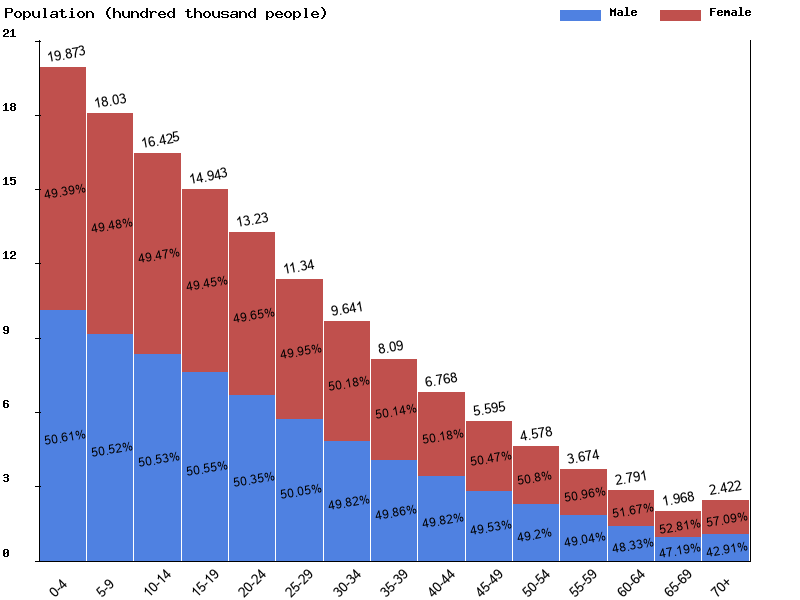
| Age | Both Sexes Population | Male Population | Female Population | Both Sexes (%) | Male (%) | Female (%) | Sex ratio (female/male) |
|---|---|---|---|---|---|---|---|
| Total | 13,936,891 | 6,970,721 | 6,966,170 | 100 | 100 | 100 | 100.1 |
| 00-04 | 1,987,332 | 1,005,740 | 981,592 | 14.3 | 14.4 | 14.1 | 102.5 |
| 05-09 | 1,803,026 | 910,847 | 892,179 | 12.9 | 13.1 | 12.8 | 102.1 |
| 10-14 | 1,642,511 | 830,021 | 812,490 | 11.8 | 11.9 | 11.7 | 102.2 |
| 15-19 | 1,494,272 | 755,315 | 738,957 | 10.7 | 10.8 | 10.6 | 102.2 |
| 20-24 | 1,323,034 | 666,120 | 656,914 | 9.5 | 9.6 | 9.4 | 101.4 |
| 25-29 | 1,134,038 | 567,576 | 566,462 | 8.1 | 8.1 | 8.1 | 100.2 |
| 30-34 | 964,064 | 480,329 | 483,735 | 6.9 | 6.9 | 6.9 | 99.3 |
| 35-39 | 808,950 | 403,312 | 405,638 | 5.8 | 5.8 | 5.8 | 99.4 |
| 40-44 | 676,782 | 337,205 | 339,577 | 4.9 | 4.8 | 4.9 | 99.3 |
| 45-49 | 559,543 | 277,150 | 282,393 | 4 | 4 | 4.1 | 98.1 |
| 50-54 | 457,830 | 225,247 | 232,583 | 3.3 | 3.2 | 3.3 | 96.8 |
| 55-59 | 367,441 | 180,181 | 187,260 | 2.6 | 2.6 | 2.7 | 96.2 |
| 60-64 | 279,120 | 134,910 | 144,210 | 2 | 1.9 | 2.1 | 93.6 |
| 65-69 | 196,794 | 92,865 | 103,929 | 1.4 | 1.3 | 1.5 | 89.4 |
| 70-74 | 127,395 | 58,293 | 69,102 | 0.9 | 0.8 | 1 | 84.4 |
| 75-79 | 71,395 | 29,082 | 42,313 | 0.5 | 0.4 | 0.6 | 68.7 |
| 80-84 | 33,054 | 12,885 | 20,169 | 0.2 | 0.2 | 0.3 | 63.9 |
| 85-89 | 8,826 | 3,173 | 5,653 | 0.1 | 0 | 0.1 | 56.1 |
| 90-94 | 1,361 | 435 | 926 | 0 | 0 | 0 | 47 |
| 95-99 | 116 | 33 | 83 | 0 | 0 | 0 | 39.8 |
| 100+ | 7 | 2 | 5 | 0 | 0 | 0 | 40 |
| Year | Population | Yearly % Change |
Yearly Change |
Sex ratio | Density (P/Km²) |
|---|---|---|---|---|---|
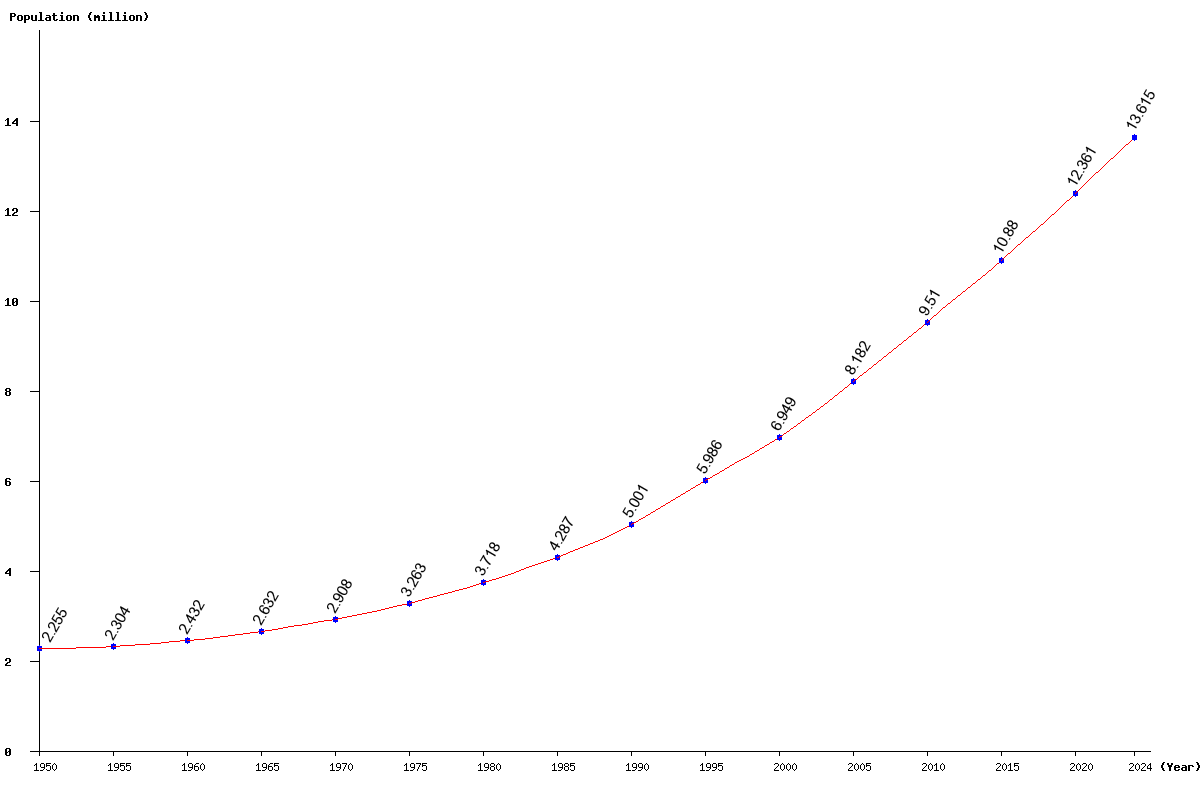
| 2024 | 13,614,682 | 2.40 | 318,813 | 100.03 | 120.74 |
| 2023 | 13,295,869 | 2.43 | 315,315 | 99.99 | 117.91 |
| 2022 | 12,980,554 | 2.46 | 311,744 | 99.94 | 115.12 |
| 2021 | 12,668,810 | 2.49 | 308,084 | 99.89 | 112.35 |
| 2020 | 12,360,726 | 2.53 | 304,522 | 99.83 | 109.62 |
| 2019 | 12,056,204 | 2.56 | 300,867 | 99.77 | 106.92 |
| 2018 | 11,755,337 | 2.59 | 296,726 | 99.71 | 104.25 |
| 2017 | 11,458,611 | 2.61 | 291,953 | 99.64 | 101.62 |
| 2016 | 11,166,658 | 2.64 | 286,829 | 99.56 | 99.03 |
| 2015 | 10,879,829 | 2.65 | 281,347 | 99.49 | 96.49 |
| 2014 | 10,598,482 | 2.68 | 276,250 | 99.41 | 93.99 |
| 2013 | 10,322,232 | 2.71 | 272,440 | 99.34 | 91.54 |
| 2012 | 10,049,792 | 2.77 | 270,401 | 99.25 | 89.13 |
| 2011 | 9,779,391 | 2.83 | 269,593 | 99.15 | 86.73 |
| 2010 | 9,509,798 | 2.91 | 268,816 | 99.01 | 84.34 |
| 2005 | 8,182,362 | 17.74 | 1,232,996 | 97.91 | 72.56 |
| 2000 | 6,949,366 | 16.10 | 963,708 | 96.24 | 61.63 |
| 1995 | 5,985,658 | 19.68 | 984,387 | 95.73 | 53.08 |
| 1990 | 5,001,271 | 16.65 | 714,008 | 93.56 | 44.35 |
| 1985 | 4,287,263 | 15.31 | 569,239 | 92.78 | 38.02 |
| 1980 | 3,718,024 | 13.95 | 455,065 | 92.44 | 32.97 |
| 1975 | 3,262,959 | 12.22 | 355,190 | 92.44 | 28.94 |
| 1970 | 2,907,769 | 10.46 | 275,409 | 92.51 | 25.79 |
| 1965 | 2,632,360 | 8.26 | 200,740 | 91.80 | 23.34 |
| 1960 | 2,431,620 | 5.56 | 128,035 | 90.72 | 21.56 |
| 1955 | 2,303,585 | 2.14 | 48,364 | 89.38 | 20.43 |
| 1950 | 2,255,221 | 87.23 | 20.00 |