Belgium population
11,580,622
Births this year: 1,150,363
Births today 103
Deaths this year 978,818
Deaths today 88
11,580,622
| Region Name | Percents | Number |
|---|---|---|
| Roman Catholic | 75% | 8,556,808 people |
| other (includes Protestant) | 25% | 2,852,269 people |
| Ethnic groups Name | Percents | Number |
|---|---|---|
| Fleming | 58% | 6,617,265 people |
| Walloon | 31% | 3,536,814 people |
| mixed or other | 11% | 1,254,998 people |
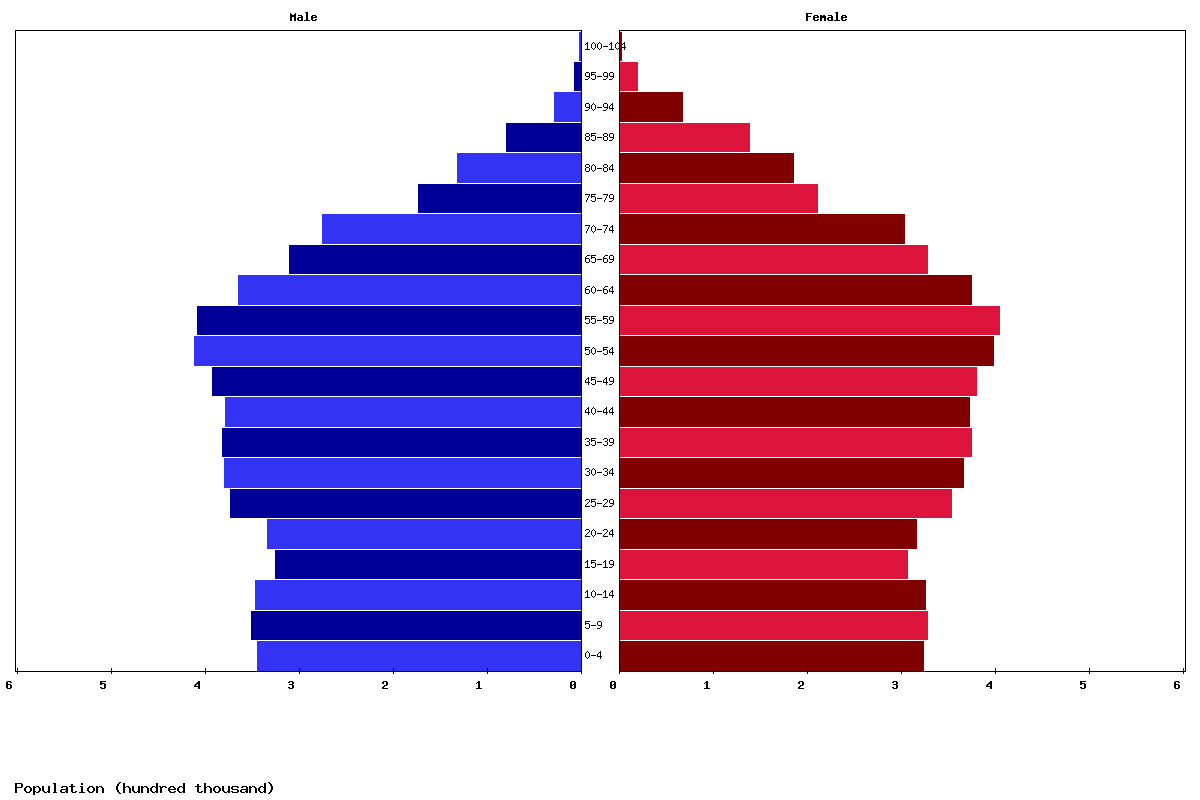
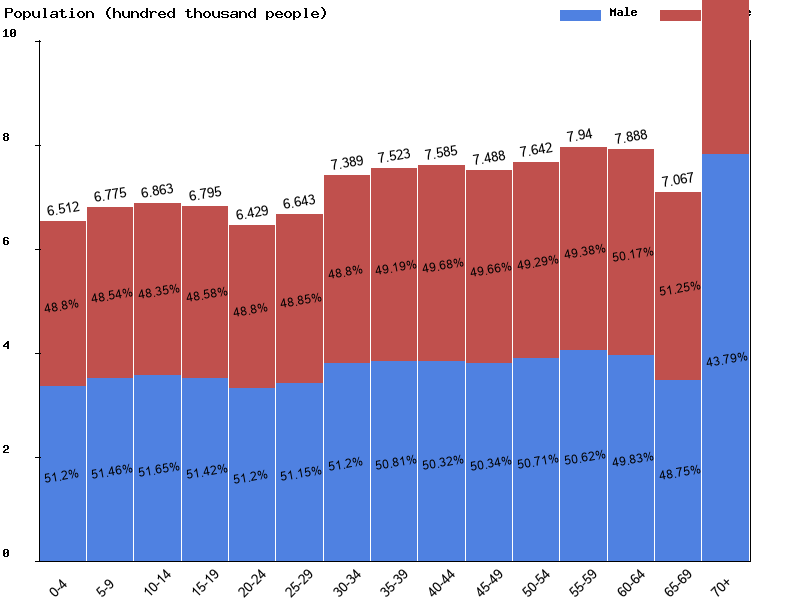
| Age | Both Sexes Population | Male Population | Female Population | Both Sexes (%) | Male (%) | Female (%) | Sex ratio (female/male) |
|---|---|---|---|---|---|---|---|
| Total | 11,836,636 | 5,881,682 | 5,954,954 | 100 | 100 | 100 | 98.8 |
| 00-04 | 651,236 | 333,422 | 317,814 | 5.5 | 5.7 | 5.3 | 104.9 |
| 05-09 | 677,526 | 348,660 | 328,866 | 5.7 | 5.9 | 5.5 | 106 |
| 10-14 | 686,327 | 354,455 | 331,872 | 5.8 | 6 | 5.6 | 106.8 |
| 15-19 | 679,523 | 349,392 | 330,131 | 5.7 | 5.9 | 5.5 | 105.8 |
| 20-24 | 642,917 | 329,155 | 313,762 | 5.4 | 5.6 | 5.3 | 104.9 |
| 25-29 | 664,282 | 339,791 | 324,491 | 5.6 | 5.8 | 5.4 | 104.7 |
| 30-34 | 738,867 | 378,315 | 360,552 | 6.2 | 6.4 | 6.1 | 104.9 |
| 35-39 | 752,265 | 382,222 | 370,043 | 6.4 | 6.5 | 6.2 | 103.3 |
| 40-44 | 758,513 | 381,667 | 376,846 | 6.4 | 6.5 | 6.3 | 101.3 |
| 45-49 | 748,833 | 376,935 | 371,898 | 6.3 | 6.4 | 6.2 | 101.4 |
| 50-54 | 764,162 | 387,504 | 376,658 | 6.5 | 6.6 | 6.3 | 102.9 |
| 55-59 | 794,022 | 401,917 | 392,105 | 6.7 | 6.8 | 6.6 | 102.5 |
| 60-64 | 788,827 | 393,081 | 395,746 | 6.7 | 6.7 | 6.6 | 99.3 |
| 65-69 | 706,721 | 344,526 | 362,195 | 6 | 5.9 | 6.1 | 95.1 |
| 70-74 | 596,785 | 284,728 | 312,057 | 5 | 4.8 | 5.2 | 91.2 |
| 75-79 | 517,060 | 238,098 | 278,962 | 4.4 | 4 | 4.7 | 85.4 |
| 80-84 | 313,868 | 134,248 | 179,620 | 2.7 | 2.3 | 3 | 74.7 |
| 85-89 | 215,468 | 81,882 | 133,586 | 1.8 | 1.4 | 2.2 | 61.3 |
| 90-94 | 107,485 | 34,144 | 73,341 | 0.9 | 0.6 | 1.2 | 46.6 |
| 95-99 | 28,138 | 6,837 | 21,301 | 0.2 | 0.1 | 0.4 | 32.1 |
| 100+ | 3,811 | 703 | 3,108 | 0 | 0 | 0.1 | 22.6 |
| Year | Population | Yearly % Change |
Yearly Change |
Sex ratio | Density (P/Km²) |
|---|---|---|---|---|---|
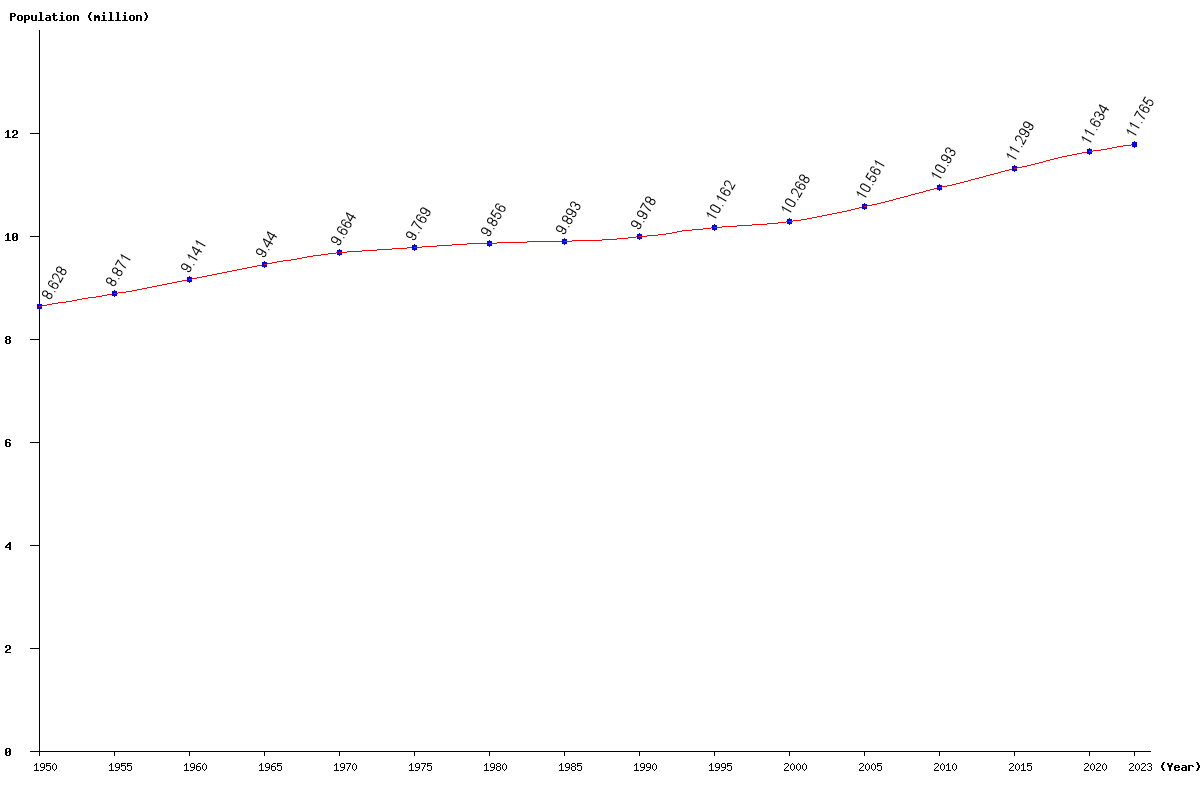
| 2024 | 11,800,602 | 0.31 | 35,915 | 98.74 | 389.72 |
| 2023 | 11,764,687 | 0.32 | 37,921 | 98.72 | 388.53 |
| 2022 | 11,726,766 | 0.37 | 42,794 | 98.68 | 387.28 |
| 2021 | 11,683,972 | 0.43 | 49,641 | 98.59 | 385.86 |
| 2020 | 11,634,331 | 0.49 | 57,260 | 98.43 | 384.22 |
| 2019 | 11,577,071 | 0.56 | 64,046 | 98.18 | 382.33 |
| 2018 | 11,513,025 | 0.60 | 69,195 | 97.86 | 380.22 |
| 2017 | 11,443,830 | 0.63 | 71,902 | 97.50 | 377.93 |
| 2016 | 11,371,928 | 0.64 | 72,736 | 97.15 | 375.56 |
| 2015 | 11,299,192 | 0.65 | 72,870 | 96.85 | 373.16 |
| 2014 | 11,226,322 | 0.66 | 73,200 | 96.61 | 370.75 |
| 2013 | 11,153,122 | 0.66 | 73,601 | 96.42 | 368.33 |
| 2012 | 11,079,521 | 0.68 | 74,346 | 96.28 | 365.90 |
| 2011 | 11,005,175 | 0.69 | 75,197 | 96.17 | 363.45 |
| 2010 | 10,929,978 | 0.70 | 75,590 | 96.08 | 360.96 |
| 2005 | 10,561,436 | 2.85 | 293,056 | 95.89 | 348.79 |
| 2000 | 10,268,380 | 1.05 | 106,466 | 95.66 | 339.11 |
| 1995 | 10,161,914 | 1.84 | 183,673 | 95.74 | 335.60 |
| 1990 | 9,978,241 | 0.86 | 84,742 | 95.67 | 329.53 |
| 1985 | 9,893,499 | 0.38 | 37,752 | 95.45 | 326.73 |
| 1980 | 9,855,747 | 0.89 | 86,741 | 95.50 | 325.49 |
| 1975 | 9,769,006 | 1.08 | 104,686 | 95.63 | 322.62 |
| 1970 | 9,664,320 | 2.37 | 224,041 | 95.82 | 319.17 |
| 1965 | 9,440,279 | 3.28 | 299,716 | 95.87 | 311.77 |
| 1960 | 9,140,563 | 3.04 | 269,771 | 95.99 | 301.87 |
| 1955 | 8,870,792 | 2.81 | 242,303 | 96.48 | 292.96 |
| 1950 | 8,628,489 | 97.17 | 284.96 |