Bahrain population
1,523,669
Births this year: 180,957
Births today 7
Deaths this year 36,191
Deaths today 1
1,523,669
| Region Name | Percents | Number |
|---|---|---|
| Muslim | 70.3% | 969,370 people |
| Christian | 14.5% | 199,941 people |
| Hindu | 9.8% | 135,133 people |
| Buddhist | 2.5% | 34,473 people |
| Jewish | 0.6% | 8,273 people |
| folk religion <.1 | 0.1% | 1,379 people |
| unaffiliated | 1.9% | 26,199 people |
| other | 0.2% | 2,758 people |
| Ethnic groups Name | Percents | Number |
|---|---|---|
| Bahraini | 46% | 634,296 people |
| Asian | 45.5% | 627,401 people |
| other Arabs | 4.7% | 64,808 people |
| African | 1.6% | 22,062 people |
| European | 1% | 13,789 people |
| other (includes Gulf Co-operative country nationals, North and South Americans, and Oceanians) | 1.2% | 16,547 people |
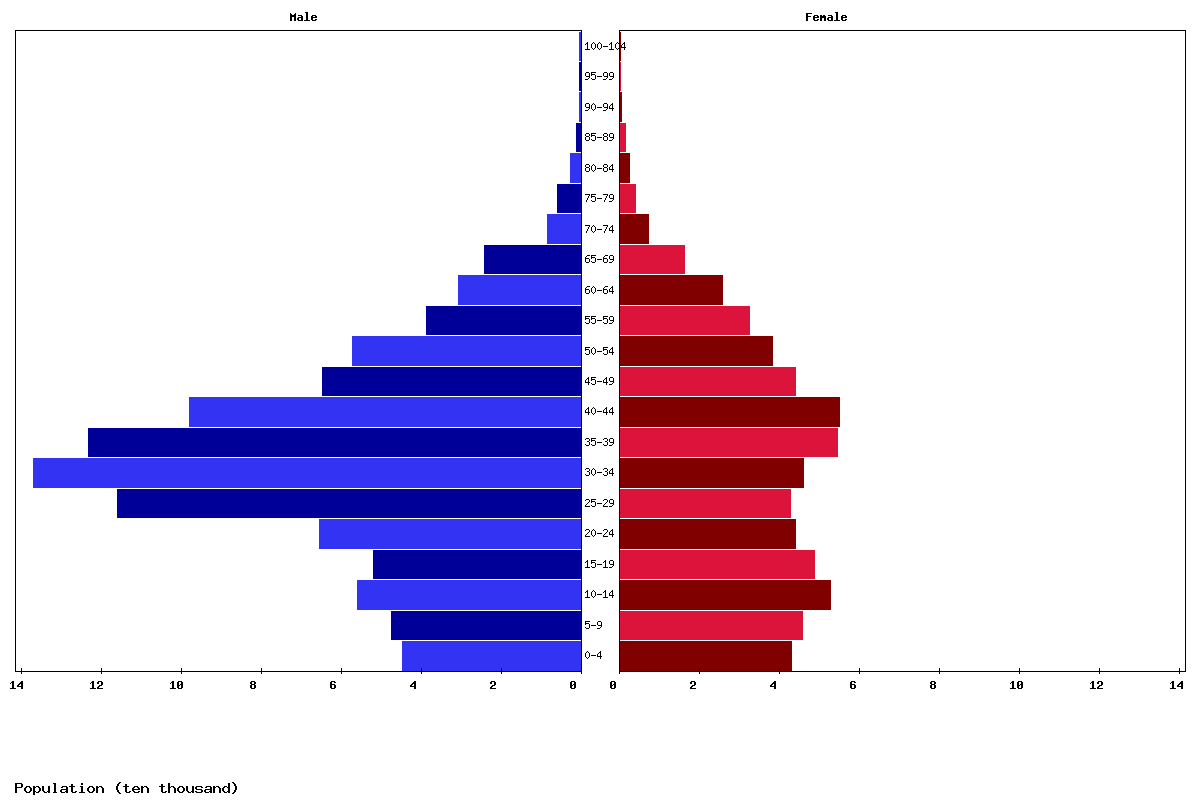
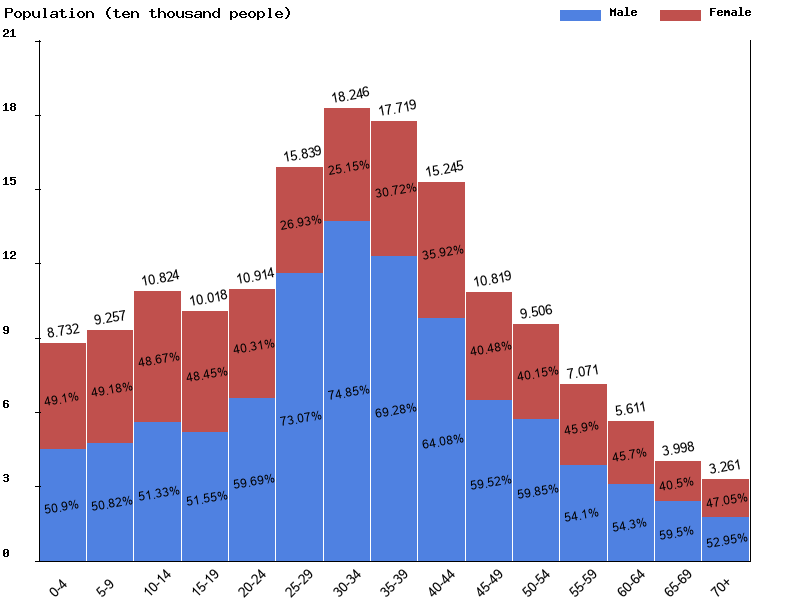
| Age | Both Sexes Population | Male Population | Female Population | Both Sexes (%) | Male (%) | Female (%) | Sex ratio (female/male) |
|---|---|---|---|---|---|---|---|
| Total | 1,570,590 | 967,651 | 602,939 | 100 | 100 | 100 | 160.5 |
| 00-04 | 87,322 | 44,447 | 42,875 | 5.6 | 4.6 | 7.1 | 103.7 |
| 05-09 | 92,571 | 47,044 | 45,527 | 5.9 | 4.9 | 7.6 | 103.3 |
| 10-14 | 108,239 | 55,554 | 52,685 | 6.9 | 5.7 | 8.7 | 105.4 |
| 15-19 | 100,177 | 51,645 | 48,532 | 6.4 | 5.3 | 8 | 106.4 |
| 20-24 | 109,137 | 65,145 | 43,992 | 6.9 | 6.7 | 7.3 | 148.1 |
| 25-29 | 158,393 | 115,734 | 42,659 | 10.1 | 12 | 7.1 | 271.3 |
| 30-34 | 182,457 | 136,572 | 45,885 | 11.6 | 14.1 | 7.6 | 297.6 |
| 35-39 | 177,188 | 122,752 | 54,436 | 11.3 | 12.7 | 9 | 225.5 |
| 40-44 | 152,454 | 97,693 | 54,761 | 9.7 | 10.1 | 9.1 | 178.4 |
| 45-49 | 108,189 | 64,399 | 43,790 | 6.9 | 6.7 | 7.3 | 147.1 |
| 50-54 | 95,055 | 56,891 | 38,164 | 6.1 | 5.9 | 6.3 | 149.1 |
| 55-59 | 70,713 | 38,254 | 32,459 | 4.5 | 4 | 5.4 | 117.9 |
| 60-64 | 56,111 | 30,468 | 25,643 | 3.6 | 3.1 | 4.3 | 118.8 |
| 65-69 | 39,978 | 23,787 | 16,191 | 2.5 | 2.5 | 2.7 | 146.9 |
| 70-74 | 15,389 | 8,154 | 7,235 | 1 | 0.8 | 1.2 | 112.7 |
| 75-79 | 9,646 | 5,716 | 3,930 | 0.6 | 0.6 | 0.7 | 145.4 |
| 80-84 | 4,751 | 2,253 | 2,498 | 0.3 | 0.2 | 0.4 | 90.2 |
| 85-89 | 2,201 | 897 | 1,304 | 0.1 | 0.1 | 0.2 | 68.8 |
| 90-94 | 489 | 194 | 295 | 0 | 0 | 0 | 65.8 |
| 95-99 | 121 | 49 | 72 | 0 | 0 | 0 | 68.1 |
| 100+ | 9 | 3 | 6 | 0 | 0 | 0 | 50 |
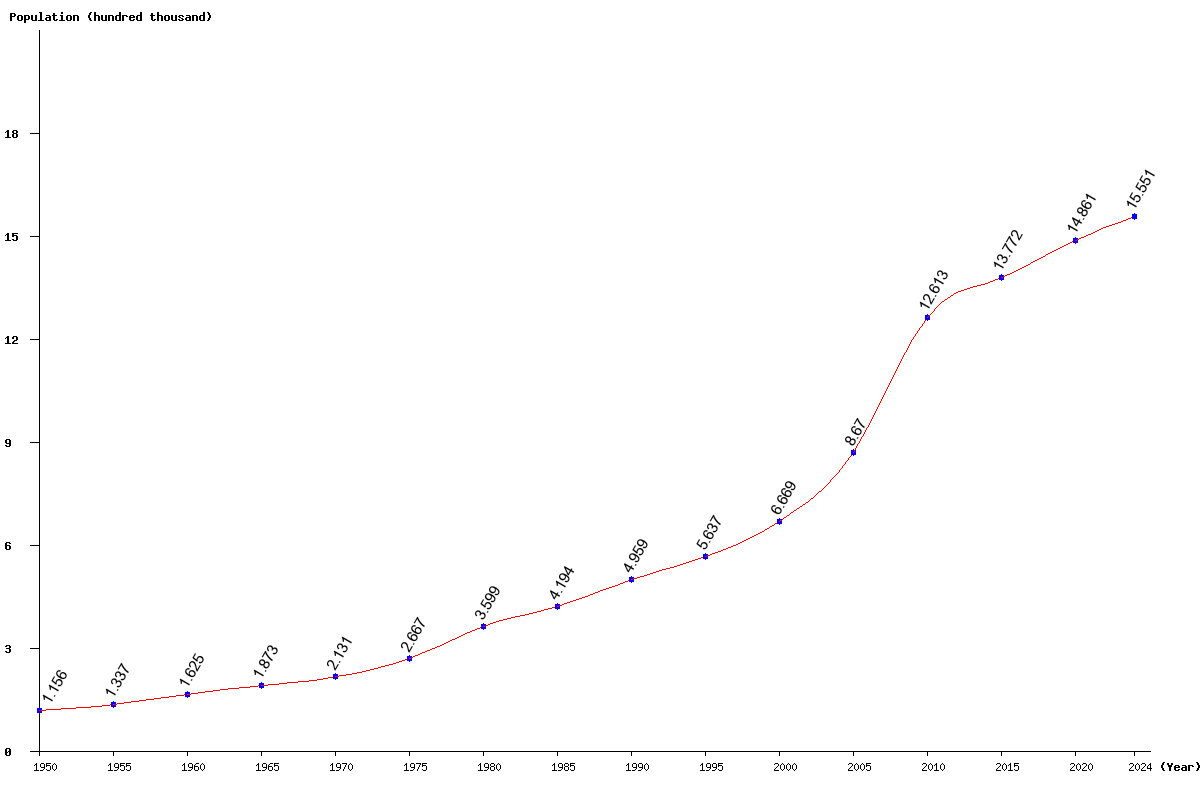
| Year | Population | Yearly % Change |
Yearly Change |
Sex ratio | Density (P/Km²) |
|---|---|---|---|---|---|
| 2025 | 1,570,590 | 0.99 | 15,458 | 160.49 | 2,066.57 |
| 2024 | 1,555,132 | 1.04 | 15,937 | 161.04 | 2,046.23 |
| 2023 | 1,539,195 | 1.09 | 16,638 | 161.59 | 2,025.26 |
| 2022 | 1,522,557 | 1.17 | 17,633 | 162.10 | 2,003.36 |
| 2021 | 1,504,924 | 1.27 | 18,813 | 162.52 | 1,980.16 |
| 2020 | 1,486,111 | 1.42 | 20,826 | 162.81 | 1,955.41 |
| 2019 | 1,465,285 | 1.59 | 22,891 | 162.90 | 1,928.01 |
| 2018 | 1,442,394 | 1.66 | 23,499 | 162.82 | 1,897.89 |
| 2017 | 1,418,895 | 1.58 | 22,066 | 162.69 | 1,866.97 |
| 2016 | 1,396,829 | 1.42 | 19,592 | 162.71 | 1,837.93 |
| 2015 | 1,377,237 | 1.12 | 15,307 | 163.02 | 1,812.15 |
| 2014 | 1,361,930 | 0.93 | 12,503 | 163.72 | 1,792.01 |
| 2013 | 1,349,427 | 1.19 | 15,850 | 164.73 | 1,775.56 |
| 2012 | 1,333,577 | 2.11 | 27,563 | 165.72 | 1,754.71 |
| 2011 | 1,306,014 | 3.54 | 44,695 | 166.24 | 1,718.44 |
| 2010 | 1,261,319 | 5.39 | 64,545 | 165.94 | 1,659.63 |
| 2005 | 867,014 | 30.02 | 200,159 | 150.49 | 1,140.81 |
| 2000 | 666,855 | 18.29 | 103,125 | 133.55 | 877.44 |
| 1995 | 563,730 | 13.67 | 67,786 | 135.79 | 741.75 |
| 1990 | 495,944 | 18.24 | 76,519 | 136.42 | 652.56 |
| 1985 | 419,425 | 16.54 | 59,523 | 133.36 | 551.88 |
| 1980 | 359,902 | 34.95 | 93,216 | 140.66 | 473.56 |
| 1975 | 266,686 | 25.14 | 53,584 | 126.71 | 350.90 |
| 1970 | 213,102 | 13.75 | 25,754 | 117.49 | 280.40 |
| 1965 | 187,348 | 15.29 | 24,847 | 120.73 | 246.51 |
| 1960 | 162,501 | 21.58 | 28,848 | 115.32 | 213.82 |
| 1955 | 133,653 | 15.60 | 18,039 | 114.02 | 175.86 |
| 1950 | 115,614 | 116.11 | 152.12 |