Aruba population
118,377
Births this year: 14,073
Births today 4
Deaths this year 9,345
Deaths today 2
118,377
| Region Name | Percents | Number |
|---|---|---|
| Roman Catholic | 75.3% | 85,577 people |
| Protestant (includes Methodist, Adventist, Anglican, other Protestant) | 4.9% | 5,569 people |
| Jehovah | 0 people |
| Ethnic groups Name | Percents | Number |
|---|---|---|
| Dutch | 82.1% | 93,305 people |
| Colombian | 6.6% | 7,501 people |
| Venezuelan | 2.2% | 2,500 people |
| Dominican | 2.2% | 2,500 people |
| Haitian | 1.2% | 1,364 people |
| other | 5.5% | 6,251 people |
| unspecified | 0.1% | 114 people |
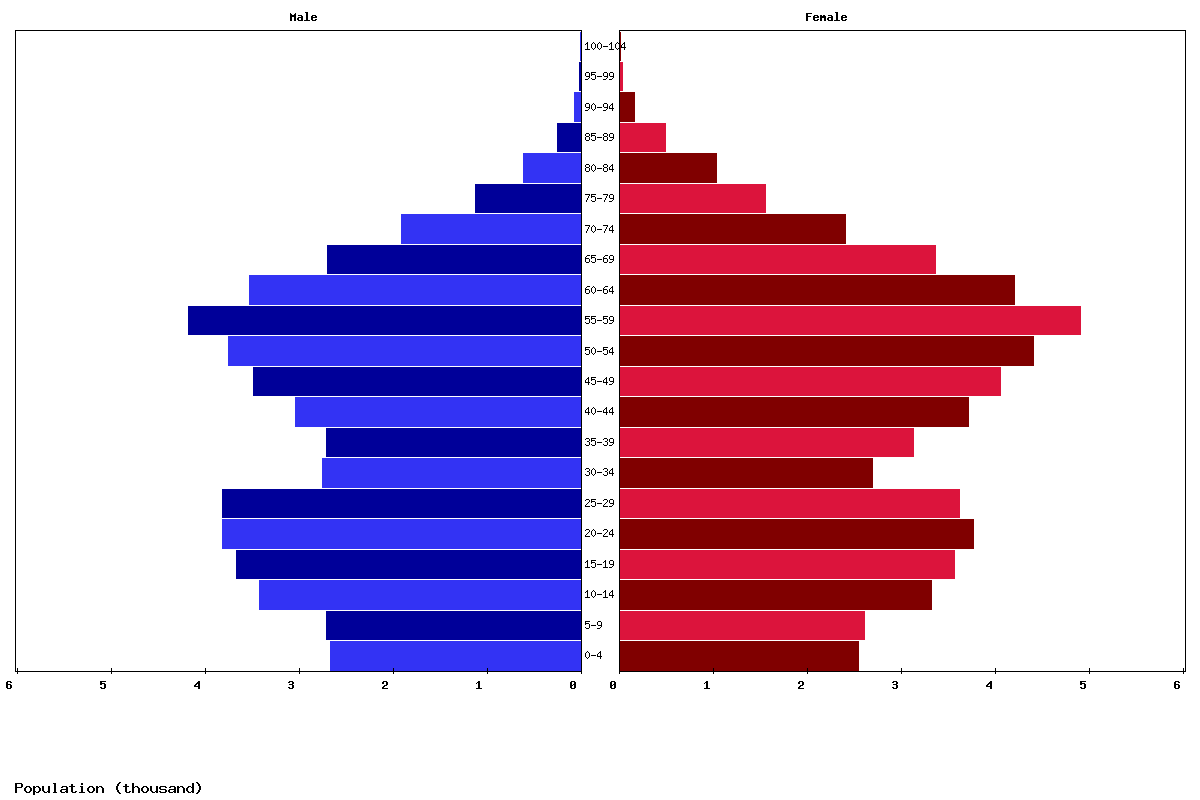
| Age | Both Sexes Population | Male Population | Female Population | Both Sexes (%) | Male (%) | Female (%) | Sex ratio (female/male) |
|---|---|---|---|---|---|---|---|
| Total | 106,483 | 50,360 | 56,123 | 100 | 100 | 100 | 89.7 |
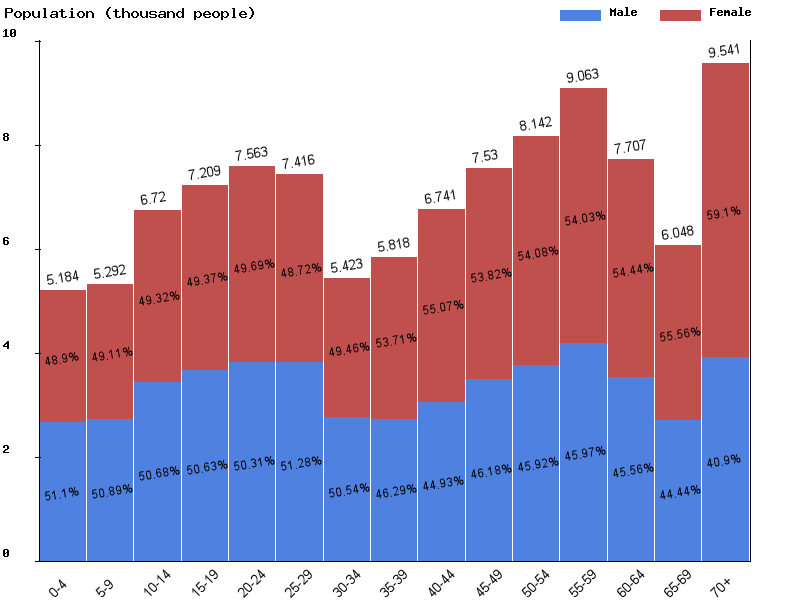
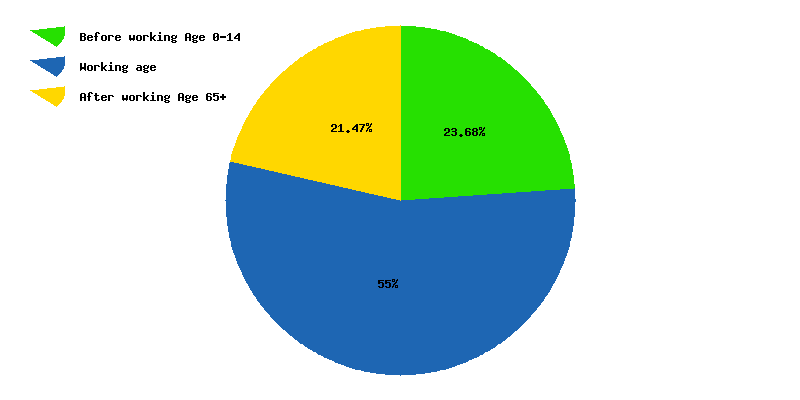
| 00-04 | 5,502 | 2,813 | 2,689 | 5.2 | 5.6 | 4.8 | 104.6 |
| 05-09 | 5,222 | 2,661 | 2,561 | 4.9 | 5.3 | 4.6 | 103.9 |
| 10-14 | 5,355 | 2,712 | 2,643 | 5 | 5.4 | 4.7 | 102.6 |
| 15-19 | 6,753 | 3,412 | 3,341 | 6.3 | 6.8 | 6 | 102.1 |
| 20-24 | 7,218 | 3,644 | 3,574 | 6.8 | 7.2 | 6.4 | 102 |
| 25-29 | 7,631 | 3,825 | 3,806 | 7.2 | 7.6 | 6.8 | 100.5 |
| 30-34 | 7,518 | 3,833 | 3,685 | 7.1 | 7.6 | 6.6 | 104 |
| 35-39 | 5,508 | 2,765 | 2,743 | 5.2 | 5.5 | 4.9 | 100.8 |
| 40-44 | 5,884 | 2,713 | 3,171 | 5.5 | 5.4 | 5.7 | 85.6 |
| 45-49 | 6,745 | 3,019 | 3,726 | 6.3 | 6 | 6.6 | 81 |
| 50-54 | 7,438 | 3,418 | 4,020 | 7 | 6.8 | 7.2 | 85 |
| 55-59 | 7,940 | 3,616 | 4,324 | 7.5 | 7.2 | 7.7 | 83.6 |
| 60-64 | 8,692 | 3,935 | 4,757 | 8.2 | 7.8 | 8.5 | 82.7 |
| 65-69 | 7,185 | 3,193 | 3,992 | 6.7 | 6.3 | 7.1 | 80 |
| 70-74 | 5,353 | 2,287 | 3,066 | 5 | 4.5 | 5.5 | 74.6 |
| 75-79 | 3,480 | 1,446 | 2,034 | 3.3 | 2.9 | 3.6 | 71.1 |
| 80-84 | 1,852 | 707 | 1,145 | 1.7 | 1.4 | 2 | 61.7 |
| 85-89 | 886 | 282 | 604 | 0.8 | 0.6 | 1.1 | 46.7 |
| 90-94 | 268 | 69 | 199 | 0.3 | 0.1 | 0.4 | 34.7 |
| 95-99 | 48 | 9 | 39 | 0 | 0 | 0.1 | 23.1 |
| 100+ | 5 | 1 | 4 | 0 | 0 | 0 | 25 |
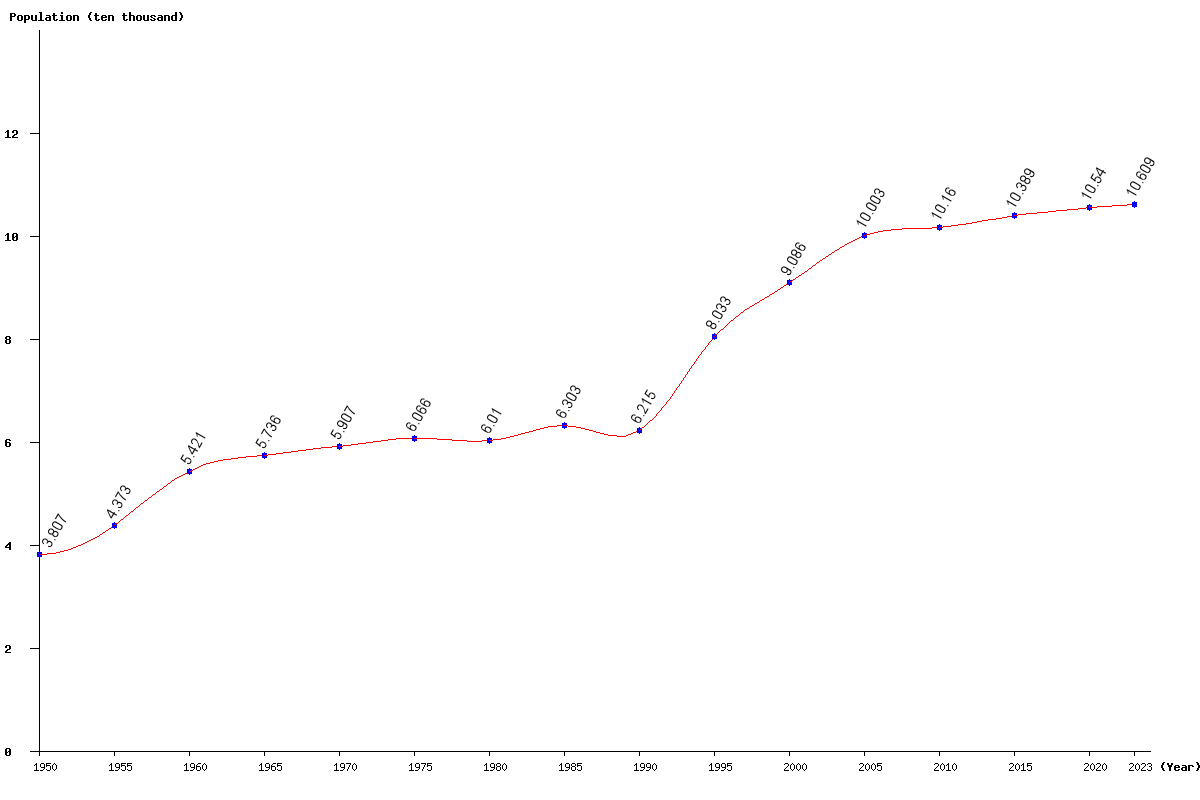
| Year | Population | Yearly % Change |
Yearly Change |
Sex ratio | Density (P/Km²) |
|---|---|---|---|---|---|
| 2025 | 106,483 | 0.17 | 186 | 89.73 | 591.57 |
| 2024 | 106,297 | 0.19 | 204 | 89.79 | 590.54 |
| 2023 | 106,093 | 0.20 | 217 | 89.86 | 589.41 |
| 2022 | 105,876 | 0.22 | 233 | 89.93 | 588.20 |
| 2021 | 105,643 | 0.23 | 246 | 90.01 | 586.91 |
| 2020 | 105,397 | 0.24 | 255 | 90.09 | 585.54 |
| 2019 | 105,142 | 0.25 | 266 | 90.18 | 584.12 |
| 2018 | 104,876 | 0.28 | 288 | 90.27 | 582.64 |
| 2017 | 104,588 | 0.31 | 325 | 90.36 | 581.04 |
| 2016 | 104,263 | 0.36 | 374 | 90.46 | 579.24 |
| 2015 | 103,889 | 0.43 | 448 | 90.57 | 577.16 |
| 2014 | 103,441 | 0.51 | 520 | 90.71 | 574.67 |
| 2013 | 102,921 | 0.52 | 528 | 90.87 | 571.78 |
| 2012 | 102,393 | 0.45 | 457 | 91.01 | 568.85 |
| 2011 | 101,936 | 0.33 | 339 | 91.11 | 566.31 |
| 2010 | 101,597 | 0.18 | 181 | 91.12 | 564.43 |
| 2005 | 100,031 | 10.10 | 9,173 | 90.69 | 555.73 |
| 2000 | 90,858 | 13.11 | 10,532 | 93.27 | 504.77 |
| 1995 | 80,326 | 29.25 | 18,178 | 97.33 | 446.26 |
| 1990 | 62,148 | -1.40 | -880 | 97.35 | 345.27 |
| 1985 | 63,028 | 4.88 | 2,932 | 95.13 | 350.16 |
| 1980 | 60,096 | -0.92 | -559 | 95.10 | 333.87 |
| 1975 | 60,655 | 2.69 | 1,590 | 94.73 | 336.97 |
| 1970 | 59,065 | 2.97 | 1,705 | 95.71 | 328.14 |
| 1965 | 57,360 | 5.81 | 3,152 | 95.99 | 318.67 |
| 1960 | 54,208 | 23.97 | 10,481 | 96.16 | 301.16 |
| 1955 | 43,727 | 14.87 | 5,661 | 94.76 | 242.93 |
| 1950 | 38,066 | 93.59 | 211.48 |