Antigua and Barbuda population
102,944
Births this year: 14,648
Births today 4
Deaths this year 5,284
Deaths today 1
102,944
| Region Name | Percents | Number |
|---|---|---|
| Protestant (Anglican, Seventh-Day Adventist, Pentecostal, Moravian, Methodist, Baptist, Church of God) | 76.4% | 71,496 people |
| Roman Catholic | 10.4% | 9,732 people |
| other Christian | 5.4% | 5,053 people |
| other | 2% | 1,872 people |
| none or unspecified | 5.8% | 5,428 people |
| Ethnic groups Name | Percents | Number |
|---|---|---|
| black | 91% | 85,159 people |
| mixed | 4.4% | 4,118 people |
| white | 1.7% | 1,591 people |
| other | 2.9% | 2,714 people |
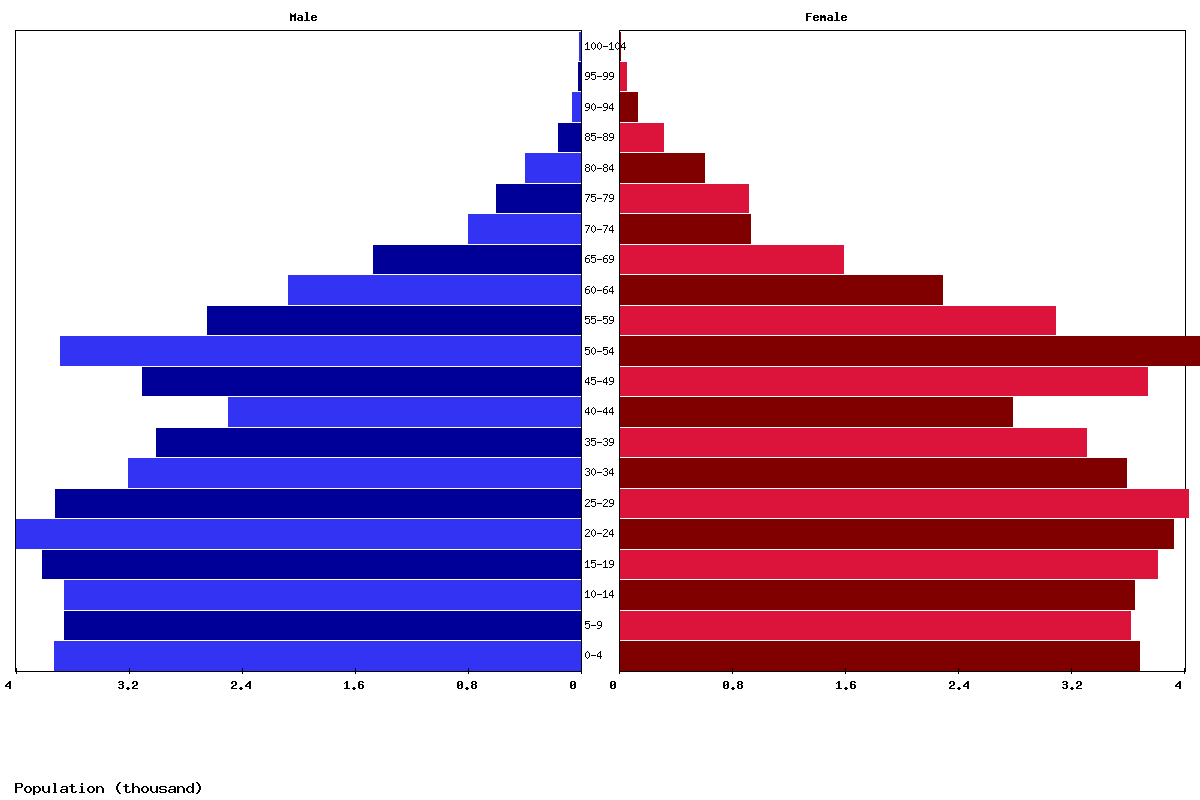
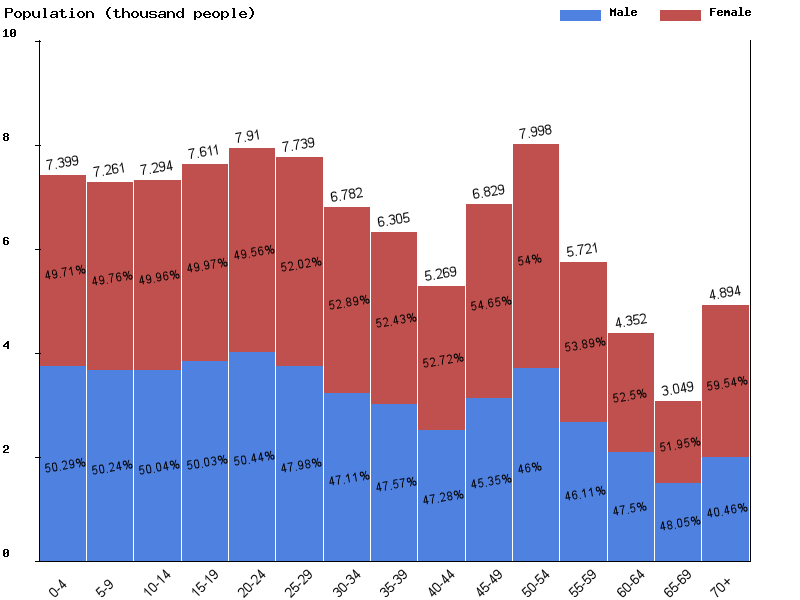
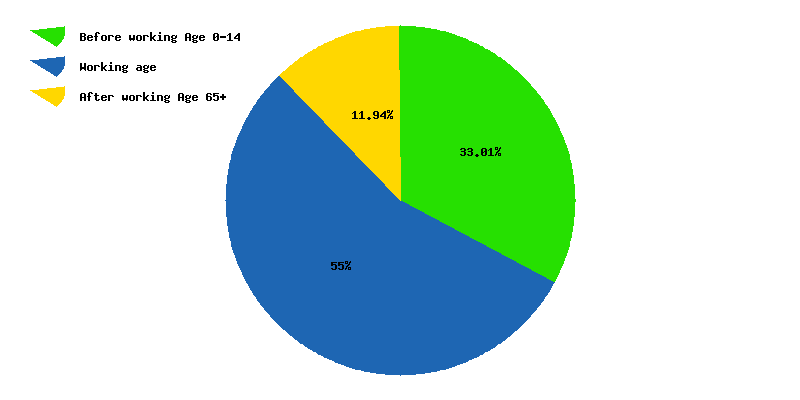
| Age | Both Sexes Population | Male Population | Female Population | Both Sexes (%) | Male (%) | Female (%) | Sex ratio (female/male) |
|---|---|---|---|---|---|---|---|
| Total | 100,872 | 48,329 | 52,543 | 100 | 100 | 100 | 92 |
| 00-04 | 7,449 | 3,748 | 3,701 | 7.4 | 7.8 | 7 | 101.3 |
| 05-09 | 7,381 | 3,711 | 3,670 | 7.3 | 7.7 | 7 | 101.1 |
| 10-14 | 7,255 | 3,644 | 3,611 | 7.2 | 7.5 | 6.9 | 100.9 |
| 15-19 | 7,288 | 3,647 | 3,641 | 7.2 | 7.5 | 6.9 | 100.2 |
| 20-24 | 7,600 | 3,803 | 3,797 | 7.5 | 7.9 | 7.2 | 100.2 |
| 25-29 | 7,886 | 3,975 | 3,911 | 7.8 | 8.2 | 7.4 | 101.6 |
| 30-34 | 7,704 | 3,691 | 4,013 | 7.6 | 7.6 | 7.6 | 92 |
| 35-39 | 6,748 | 3,175 | 3,573 | 6.7 | 6.6 | 6.8 | 88.9 |
| 40-44 | 6,266 | 2,975 | 3,291 | 6.2 | 6.2 | 6.3 | 90.4 |
| 45-49 | 5,211 | 2,456 | 2,755 | 5.2 | 5.1 | 5.2 | 89.1 |
| 50-54 | 6,691 | 3,019 | 3,672 | 6.6 | 6.2 | 7 | 82.2 |
| 55-59 | 7,751 | 3,540 | 4,211 | 7.7 | 7.3 | 8 | 84.1 |
| 60-64 | 5,470 | 2,492 | 2,978 | 5.4 | 5.2 | 5.7 | 83.7 |
| 65-69 | 4,060 | 1,892 | 2,168 | 4 | 3.9 | 4.1 | 87.3 |
| 70-74 | 2,728 | 1,269 | 1,459 | 2.7 | 2.6 | 2.8 | 87 |
| 75-79 | 1,423 | 619 | 804 | 1.4 | 1.3 | 1.5 | 77 |
| 80-84 | 1,120 | 410 | 710 | 1.1 | 0.8 | 1.4 | 57.7 |
| 85-89 | 587 | 201 | 386 | 0.6 | 0.4 | 0.7 | 52.1 |
| 90-94 | 197 | 51 | 146 | 0.2 | 0.1 | 0.3 | 34.9 |
| 95-99 | 48 | 10 | 38 | 0 | 0 | 0.1 | 26.3 |
| 100+ | 9 | 1 | 8 | 0 | 0 | 0 | 12.5 |
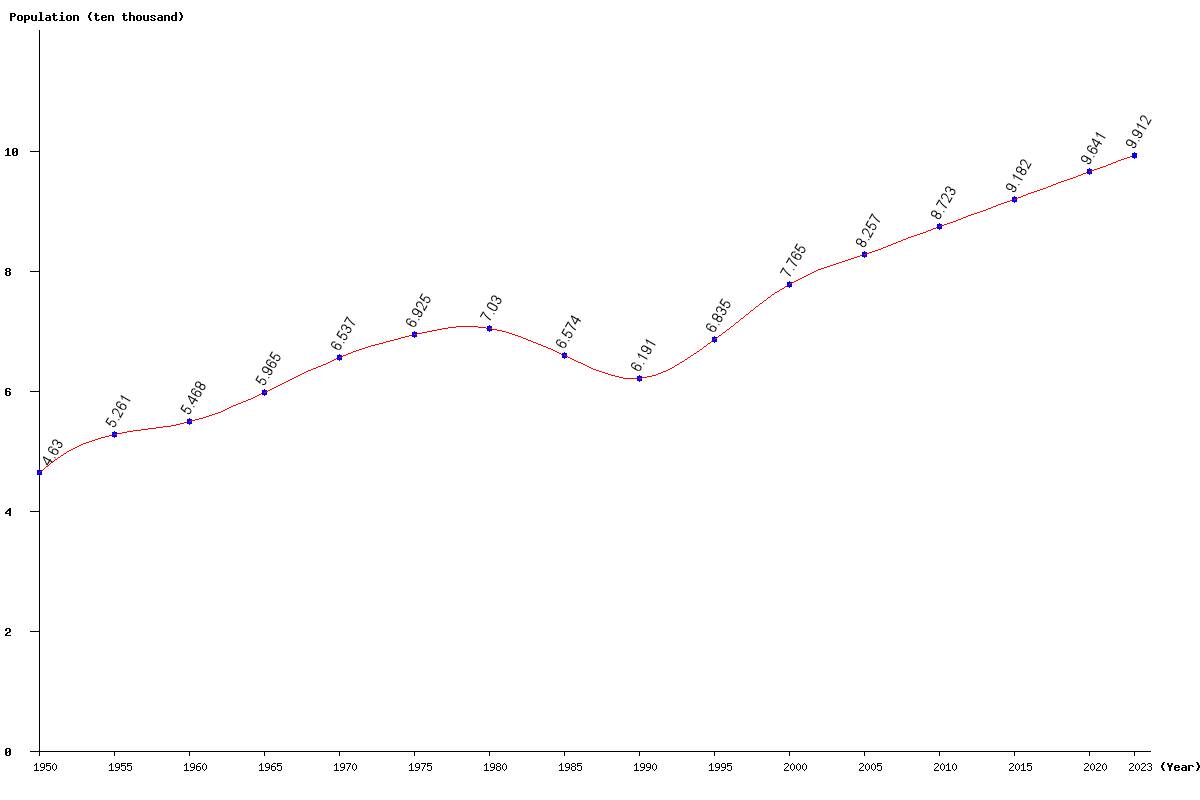
| Year | Population | Yearly % Change |
Yearly Change |
Sex ratio | Density (P/Km²) |
|---|---|---|---|---|---|
| 2025 | 100,872 | 0.87 | 867 | 91.98 | 229.25 |
| 2024 | 100,005 | 0.89 | 883 | 91.94 | 227.28 |
| 2023 | 99,122 | 0.91 | 895 | 91.90 | 225.28 |
| 2022 | 98,227 | 0.93 | 903 | 91.86 | 223.24 |
| 2021 | 97,324 | 0.94 | 911 | 91.82 | 221.19 |
| 2020 | 96,413 | 0.96 | 915 | 91.78 | 219.12 |
| 2019 | 95,498 | 0.97 | 919 | 91.74 | 217.04 |
| 2018 | 94,579 | 0.98 | 920 | 91.70 | 214.95 |
| 2017 | 93,659 | 0.99 | 921 | 91.66 | 212.86 |
| 2016 | 92,738 | 1.00 | 920 | 91.62 | 210.77 |
| 2015 | 91,818 | 1.01 | 918 | 91.57 | 208.68 |
| 2014 | 90,900 | 1.02 | 915 | 91.52 | 206.59 |
| 2013 | 89,985 | 1.03 | 916 | 91.45 | 204.51 |
| 2012 | 89,069 | 1.04 | 917 | 91.39 | 202.43 |
| 2011 | 88,152 | 1.05 | 919 | 91.36 | 200.35 |
| 2010 | 87,233 | 1.08 | 933 | 91.37 | 198.26 |
| 2005 | 82,565 | 6.33 | 4,917 | 91.40 | 187.65 |
| 2000 | 77,648 | 13.61 | 9,299 | 88.30 | 176.47 |
| 1995 | 68,349 | 10.41 | 6,443 | 94.09 | 155.34 |
| 1990 | 61,906 | -5.84 | -3,838 | 93.08 | 140.70 |
| 1985 | 65,744 | -6.48 | -4,557 | 94.03 | 149.42 |
| 1980 | 70,301 | 1.51 | 1,048 | 95.04 | 159.78 |
| 1975 | 69,253 | 5.94 | 3,884 | 91.74 | 157.39 |
| 1970 | 65,369 | 9.58 | 5,716 | 91.25 | 148.57 |
| 1965 | 59,653 | 9.09 | 4,972 | 90.41 | 135.58 |
| 1960 | 54,681 | 3.93 | 2,070 | 88.89 | 124.28 |
| 1955 | 52,611 | 13.63 | 6,310 | 97.76 | 119.57 |
| 1950 | 46,301 | 97.41 | 105.23 |