Portugal population
10,664,294
Births this year: 771,326
Births today 181
Deaths this year 940,848
Deaths today 221
10,664,294
| Region Name | Percents | Number |
|---|---|---|
| Roman Catholic | 81% | 8,775,391 people |
| other Christian | 3.3% | 357,516 people |
| other (includes Jewish, Muslim, other) | 0.6% | 65,003 people |
| none | 6.8% | 736,699 people |
| unspecified | 8.3% | 899,207 people |
| Ethnic groups Name | Percents | Number |
|---|---|---|
| homogeneous Mediterranean stock | 99.99% | 10,832,733 people |
| citizens of black African descent who immigrated to mainland during decolonization number less than 100,000 | 100,000 people |
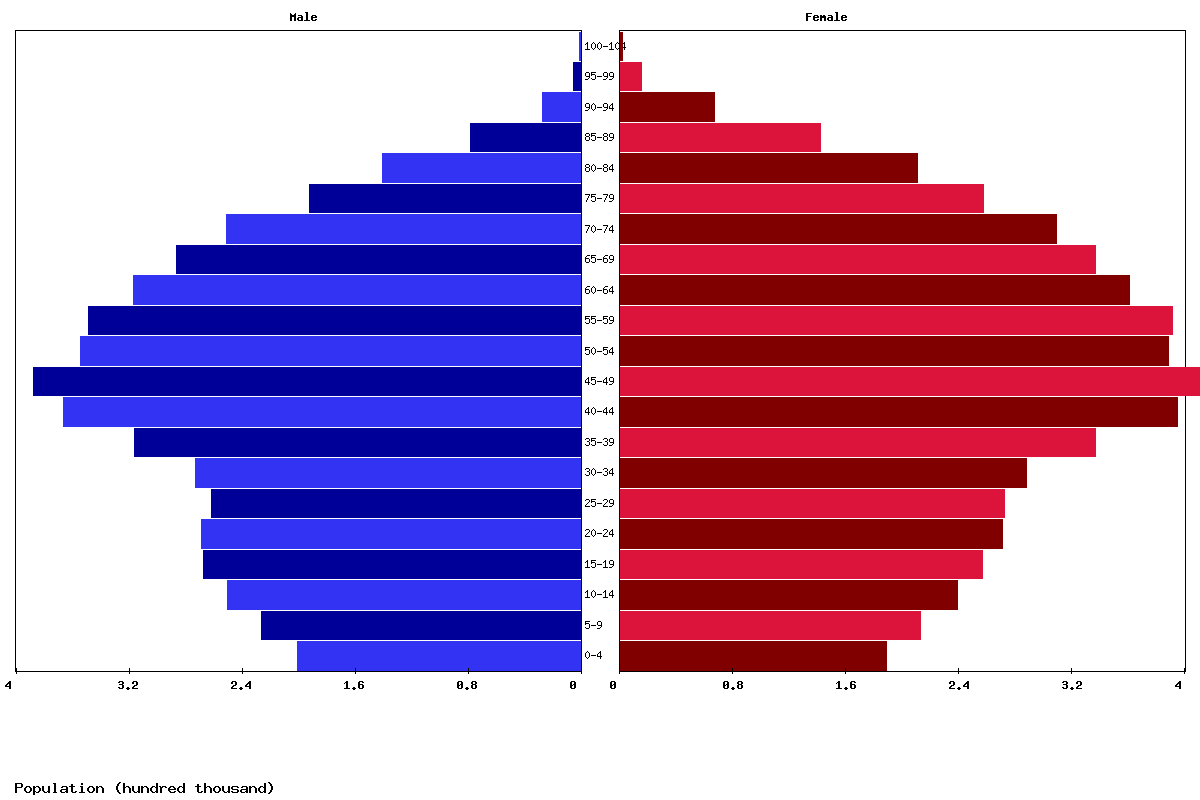
| Age | Both Sexes Population | Male Population | Female Population | Both Sexes (%) | Male (%) | Female (%) | Sex ratio (female/male) |
|---|---|---|---|---|---|---|---|
| Total | 10,160,830 | 4,803,908 | 5,356,922 | 100 | 100 | 100 | 89.7 |
| 00-04 | 388,649 | 199,947 | 188,702 | 3.8 | 4.2 | 3.5 | 106 |
| 05-09 | 438,300 | 225,478 | 212,822 | 4.3 | 4.7 | 4 | 105.9 |
| 10-14 | 488,300 | 249,216 | 239,084 | 4.8 | 5.2 | 4.5 | 104.2 |
| 15-19 | 523,214 | 266,634 | 256,580 | 5.1 | 5.6 | 4.8 | 103.9 |
| 20-24 | 538,402 | 267,782 | 270,620 | 5.3 | 5.6 | 5.1 | 99 |
| 25-29 | 532,886 | 260,967 | 271,919 | 5.2 | 5.4 | 5.1 | 96 |
| 30-34 | 560,349 | 272,278 | 288,071 | 5.5 | 5.7 | 5.4 | 94.5 |
| 35-39 | 652,480 | 315,642 | 336,838 | 6.4 | 6.6 | 6.3 | 93.7 |
| 40-44 | 760,169 | 365,707 | 394,462 | 7.5 | 7.6 | 7.4 | 92.7 |
| 45-49 | 804,874 | 386,675 | 418,199 | 7.9 | 8 | 7.8 | 92.5 |
| 50-54 | 742,119 | 353,500 | 388,619 | 7.3 | 7.4 | 7.3 | 91 |
| 55-59 | 739,200 | 348,148 | 391,052 | 7.3 | 7.2 | 7.3 | 89 |
| 60-64 | 676,139 | 315,753 | 360,386 | 6.7 | 6.6 | 6.7 | 87.6 |
| 65-69 | 622,222 | 285,661 | 336,561 | 6.1 | 5.9 | 6.3 | 84.9 |
| 70-74 | 559,738 | 250,505 | 309,233 | 5.5 | 5.2 | 5.8 | 81 |
| 75-79 | 448,577 | 191,269 | 257,308 | 4.4 | 4 | 4.8 | 74.3 |
| 80-84 | 349,864 | 139,521 | 210,343 | 3.4 | 2.9 | 3.9 | 66.3 |
| 85-89 | 219,136 | 77,290 | 141,846 | 2.2 | 1.6 | 2.6 | 54.5 |
| 90-94 | 94,016 | 26,867 | 67,149 | 0.9 | 0.6 | 1.3 | 40 |
| 95-99 | 19,903 | 4,653 | 15,250 | 0.2 | 0.1 | 0.3 | 30.5 |
| 100+ | 2,293 | 415 | 1,878 | 0 | 0 | 0 | 22.1 |
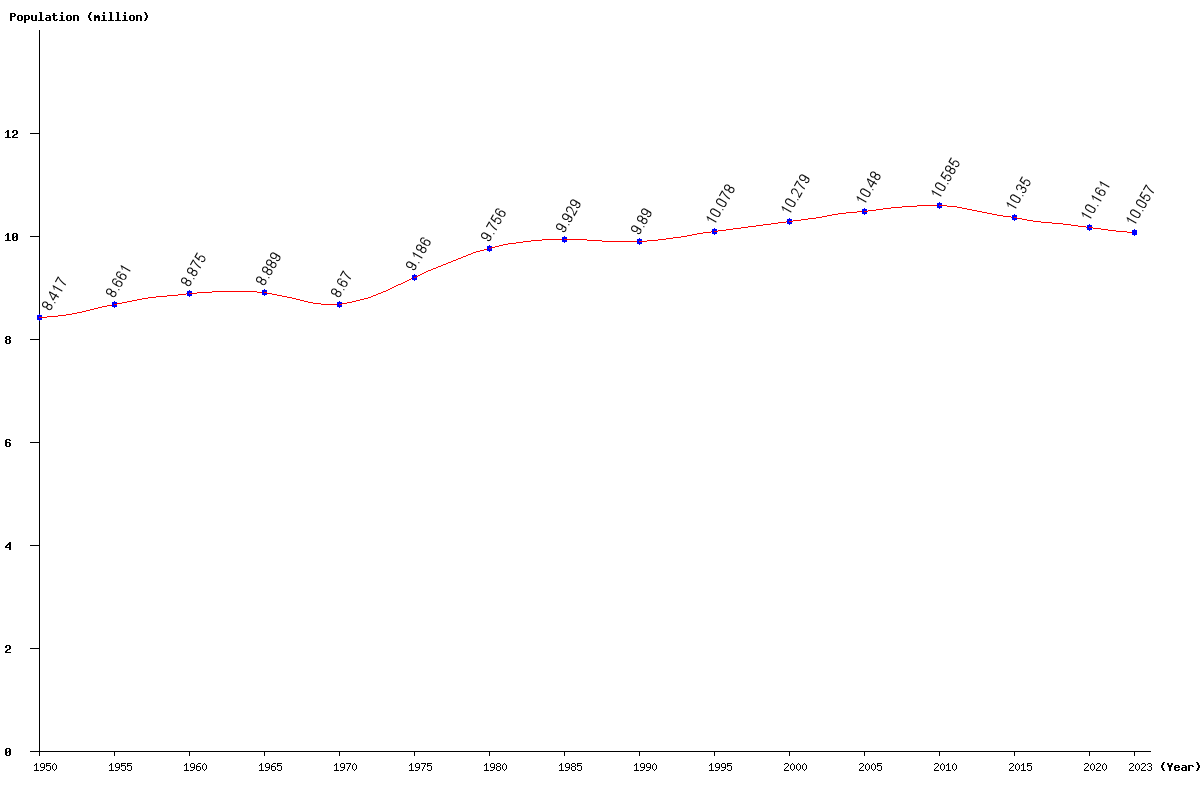
| Year | Population | Yearly % Change |
Yearly Change |
Sex ratio | Density (P/Km²) |
|---|---|---|---|---|---|
| 2023 | 10,056,583 | -0.34 | -34,170 | 89.86 | 109.80 |
| 2022 | 10,090,753 | -0.34 | -34,805 | 89.79 | 110.17 |
| 2021 | 10,125,558 | -0.35 | -35,272 | 89.72 | 110.55 |
| 2020 | 10,160,830 | -0.34 | -34,636 | 89.68 | 110.94 |
| 2019 | 10,195,466 | -0.33 | -33,966 | 89.65 | 111.32 |
| 2018 | 10,229,432 | -0.34 | -35,365 | 89.63 | 111.69 |
| 2017 | 10,264,797 | -0.38 | -39,637 | 89.66 | 112.07 |
| 2016 | 10,304,434 | -0.44 | -45,369 | 89.75 | 112.51 |
| 2015 | 10,349,803 | -0.51 | -52,540 | 89.93 | 113.00 |
| 2014 | 10,402,343 | -0.55 | -57,373 | 90.19 | 113.58 |
| 2013 | 10,459,716 | -0.53 | -55,300 | 90.52 | 114.20 |
| 2012 | 10,515,016 | -0.42 | -43,893 | 90.91 | 114.81 |
| 2011 | 10,558,909 | -0.24 | -25,928 | 91.33 | 115.28 |
| 2010 | 10,584,837 | -0.05 | -5,423 | 91.76 | 115.57 |
| 2005 | 10,480,085 | 1.96 | 201,543 | 93.69 | 114.42 |
| 2000 | 10,278,542 | 1.99 | 200,111 | 93.21 | 112.22 |
| 1995 | 10,078,431 | 1.90 | 188,112 | 93.00 | 110.04 |
| 1990 | 9,890,319 | -0.39 | -38,695 | 92.87 | 107.98 |
| 1985 | 9,929,014 | 1.78 | 173,379 | 92.99 | 108.41 |
| 1980 | 9,755,635 | 6.20 | 569,759 | 92.71 | 106.51 |
| 1975 | 9,185,876 | 5.95 | 515,524 | 91.54 | 100.29 |
| 1970 | 8,670,352 | -2.46 | -218,283 | 90.34 | 94.66 |
| 1965 | 8,888,635 | 0.15 | 13,324 | 91.31 | 97.05 |
| 1960 | 8,875,311 | 2.47 | 213,893 | 91.69 | 96.90 |
| 1955 | 8,661,418 | 2.90 | 244,449 | 92.20 | 94.57 |
| 1950 | 8,416,969 | 92.58 | 91.90 |