Poland population
38,312,269
Births this year: 2,893,610
Births today 883
Deaths this year 3,104,603
Deaths today 947
38,312,269
| Region Name | Percents | Number |
|---|---|---|
| Catholic (includes Roman Catholic and Greek Catholic, Armenian Catholic, and Byzantine-Slavic Catholic) | 87.2% | 33,592,284 people |
| Orthodox (almost all are Polish Autocephalous Orthodox) | 1.3% | 500,802 people |
| Protestant (mainly Augsburg Evangelical and Pentacostal) | 0.4% | 154,093 people |
| other | 0.4% | 154,093 people |
| unspecified | 10.7% | 4,121,989 people |
| Ethnic groups Name | Percents | Number |
|---|---|---|
| Polish | 96.9% | 37,329,040 people |
| Silesian | 1.1% | 423,756 people |
| German | 0.2% | 77,047 people |
| Ukrainian | 0.1% | 38,523 people |
| other and unspecified | 1.7% | 654,895 people |
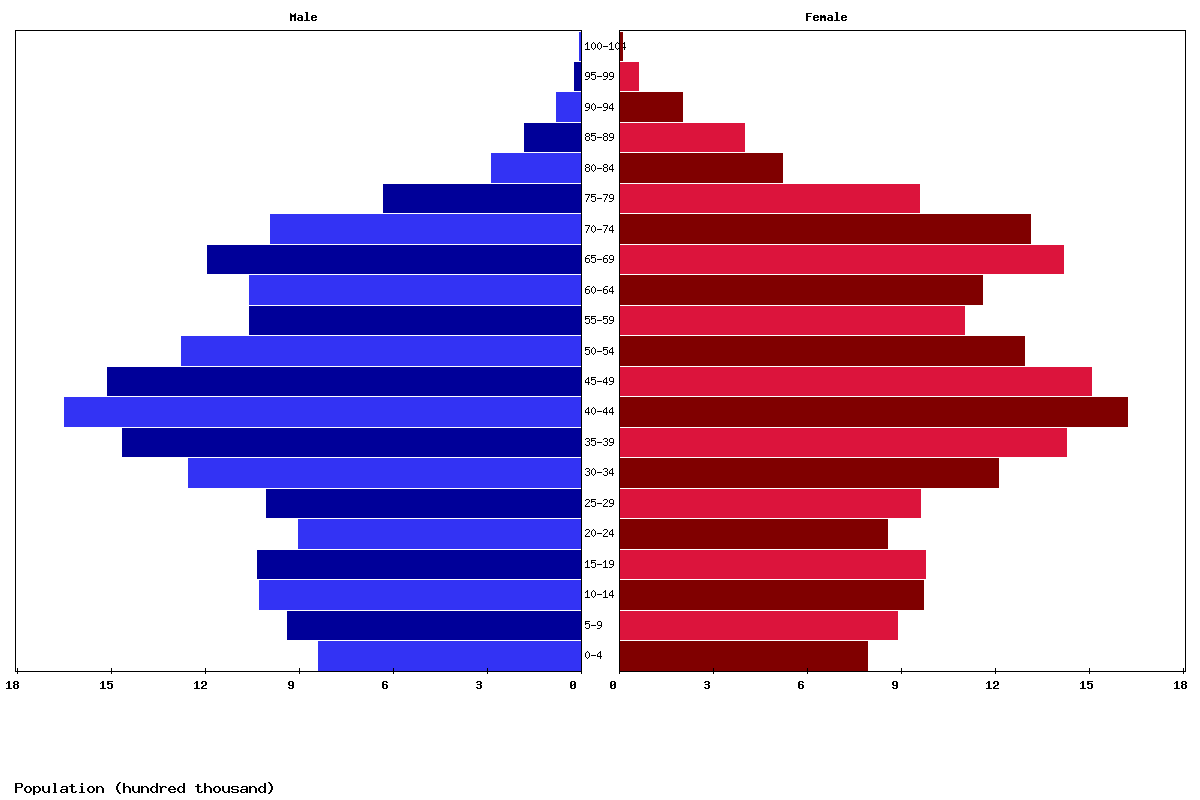
| Age | Both Sexes Population | Male Population | Female Population | Both Sexes (%) | Male (%) | Female (%) | Sex ratio (female/male) |
|---|---|---|---|---|---|---|---|
| Total | 38,407,266 | 18,561,491 | 19,845,775 | 100 | 100 | 100 | 93.5 |
| 00-04 | 1,822,683 | 935,852 | 886,831 | 4.7 | 5 | 4.5 | 105.5 |
| 05-09 | 1,992,310 | 1,022,765 | 969,545 | 5.2 | 5.5 | 4.9 | 105.5 |
| 10-14 | 2,009,142 | 1,031,269 | 977,873 | 5.2 | 5.6 | 4.9 | 105.5 |
| 15-19 | 1,760,814 | 902,839 | 857,975 | 4.6 | 4.9 | 4.3 | 105.2 |
| 20-24 | 1,974,214 | 1,010,172 | 964,042 | 5.1 | 5.4 | 4.9 | 104.8 |
| 25-29 | 2,472,240 | 1,258,912 | 1,213,328 | 6.4 | 6.8 | 6.1 | 103.8 |
| 30-34 | 2,903,283 | 1,472,291 | 1,430,992 | 7.6 | 7.9 | 7.2 | 102.9 |
| 35-39 | 3,292,583 | 1,664,817 | 1,627,766 | 8.6 | 9 | 8.2 | 102.3 |
| 40-44 | 3,051,862 | 1,536,670 | 1,515,192 | 7.9 | 8.3 | 7.6 | 101.4 |
| 45-49 | 2,616,247 | 1,311,013 | 1,305,234 | 6.8 | 7.1 | 6.6 | 100.4 |
| 50-54 | 2,226,785 | 1,105,526 | 1,121,259 | 5.8 | 6 | 5.6 | 98.6 |
| 55-59 | 2,326,088 | 1,131,859 | 1,194,229 | 6.1 | 6.1 | 6 | 94.8 |
| 60-64 | 2,798,943 | 1,317,231 | 1,481,712 | 7.3 | 7.1 | 7.5 | 88.9 |
| 65-69 | 2,546,961 | 1,142,939 | 1,404,022 | 6.6 | 6.2 | 7.1 | 81.4 |
| 70-74 | 1,852,820 | 780,687 | 1,072,133 | 4.8 | 4.2 | 5.4 | 72.8 |
| 75-79 | 1,031,784 | 394,845 | 636,939 | 2.7 | 2.1 | 3.2 | 62 |
| 80-84 | 881,678 | 300,426 | 581,252 | 2.3 | 1.6 | 2.9 | 51.7 |
| 85-89 | 549,978 | 166,613 | 383,365 | 1.4 | 0.9 | 1.9 | 43.5 |
| 90-94 | 234,472 | 61,043 | 173,429 | 0.6 | 0.3 | 0.9 | 35.2 |
| 95-99 | 56,939 | 12,592 | 44,347 | 0.1 | 0.1 | 0.2 | 28.4 |
| 100+ | 5,440 | 1,130 | 4,310 | 0 | 0 | 0 | 26.2 |
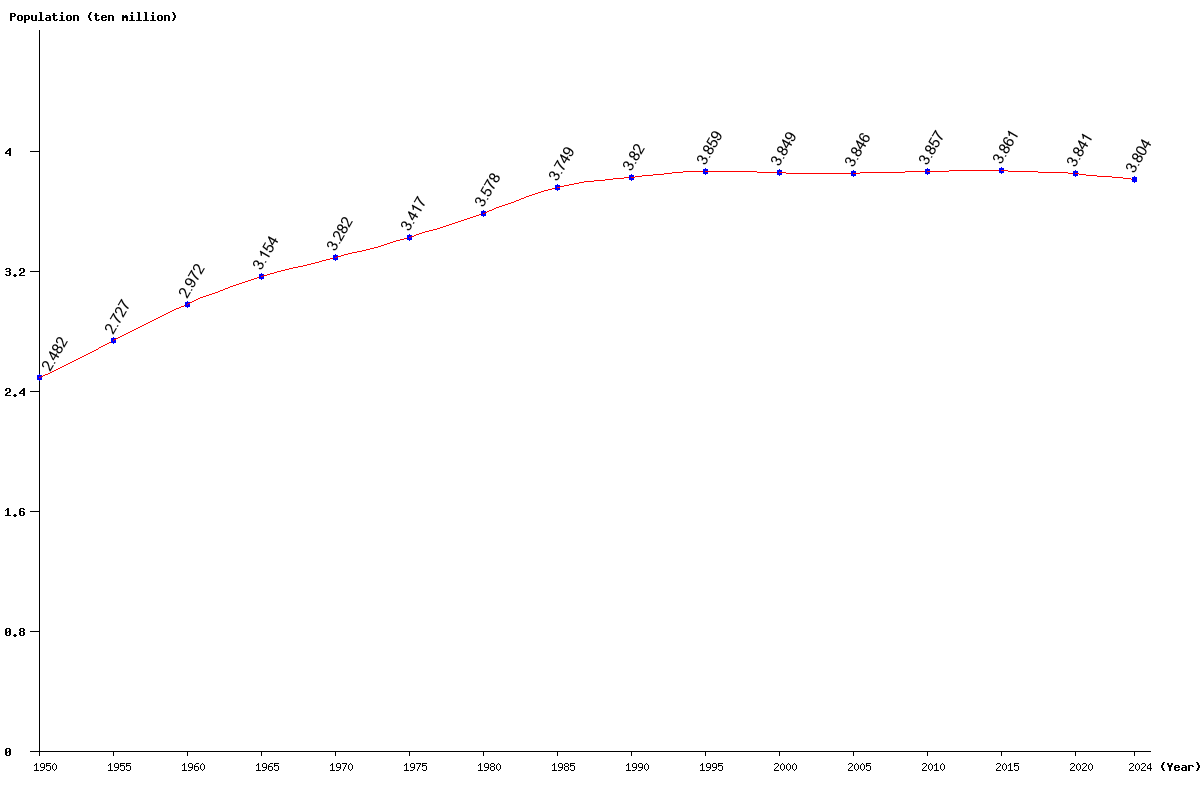
| Year | Population | Yearly % Change |
Yearly Change |
Sex ratio | Density (P/Km²) |
|---|---|---|---|---|---|
| 2023 | 38,148,414 | -0.25 | -97,492 | 93.47 | 124.57 |
| 2022 | 38,245,906 | -0.23 | -86,485 | 93.49 | 124.89 |
| 2021 | 38,332,391 | -0.19 | -74,875 | 93.51 | 125.18 |
| 2020 | 38,407,266 | -0.16 | -63,346 | 93.53 | 125.42 |
| 2019 | 38,470,612 | -0.14 | -52,116 | 93.55 | 125.63 |
| 2018 | 38,522,728 | -0.11 | -40,845 | 93.58 | 125.80 |
| 2017 | 38,563,573 | -0.08 | -29,588 | 93.60 | 125.93 |
| 2016 | 38,593,161 | -0.05 | -18,633 | 93.63 | 126.03 |
| 2015 | 38,611,794 | -0.02 | -8,180 | 93.66 | 126.09 |
| 2014 | 38,619,974 | 0.00 | 1,276 | 93.68 | 126.11 |
| 2013 | 38,618,698 | 0.02 | 9,212 | 93.71 | 126.11 |
| 2012 | 38,609,486 | 0.04 | 15,269 | 93.73 | 126.08 |
| 2011 | 38,594,217 | 0.05 | 19,535 | 93.76 | 126.03 |
| 2010 | 38,574,682 | 0.06 | 23,193 | 93.80 | 125.97 |
| 2005 | 38,463,514 | -0.06 | -22,791 | 94.06 | 125.60 |
| 2000 | 38,486,305 | -0.27 | -105,555 | 94.32 | 125.68 |
| 1995 | 38,591,860 | 1.04 | 396,602 | 94.28 | 126.02 |
| 1990 | 38,195,258 | 1.89 | 709,153 | 94.64 | 124.73 |
| 1985 | 37,486,105 | 4.76 | 1,703,250 | 95.03 | 122.41 |
| 1980 | 35,782,855 | 4.73 | 1,614,743 | 94.86 | 116.85 |
| 1975 | 34,168,112 | 4.12 | 1,351,361 | 94.77 | 111.58 |
| 1970 | 32,816,751 | 4.05 | 1,277,056 | 94.45 | 107.16 |
| 1965 | 31,539,695 | 6.14 | 1,823,332 | 94.24 | 102.99 |
| 1960 | 29,716,363 | 8.97 | 2,446,618 | 93.68 | 97.04 |
| 1955 | 27,269,745 | 9.85 | 2,445,732 | 92.20 | 89.05 |
| 1950 | 24,824,013 | 91.04 | 81.06 |