Papua New Guinea population
7,721,060
Births this year: 1,275,076
Births today 169
Deaths this year 345,333
Deaths today 46
7,721,060
| Region Name | Percents | Number |
|---|---|---|
| Roman Catholic | 27% | 1,833,656 people |
| Protestant (Evangelical Lutheran, United Church, Seventh-Day Adventist, Pentecostal, Evangelical Alliance, Anglican, Baptist, other Protestant) 69.4, other 3.6 | 6943.6% | 471,561,887 people |
| Ethnic groups Name | Percents | Number |
|---|---|---|
| Melanesian, Papuan, Negrito, Micronesian, Polynesian | 100% | 6,791,317 people |
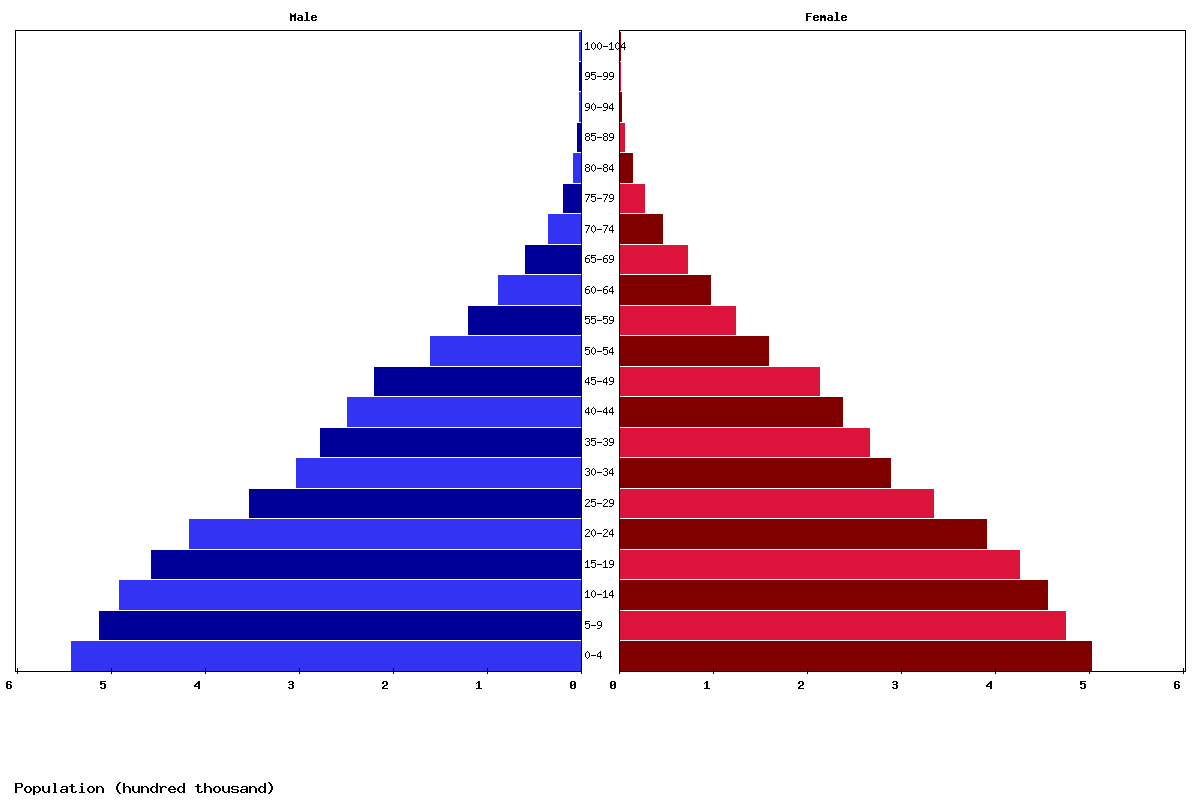
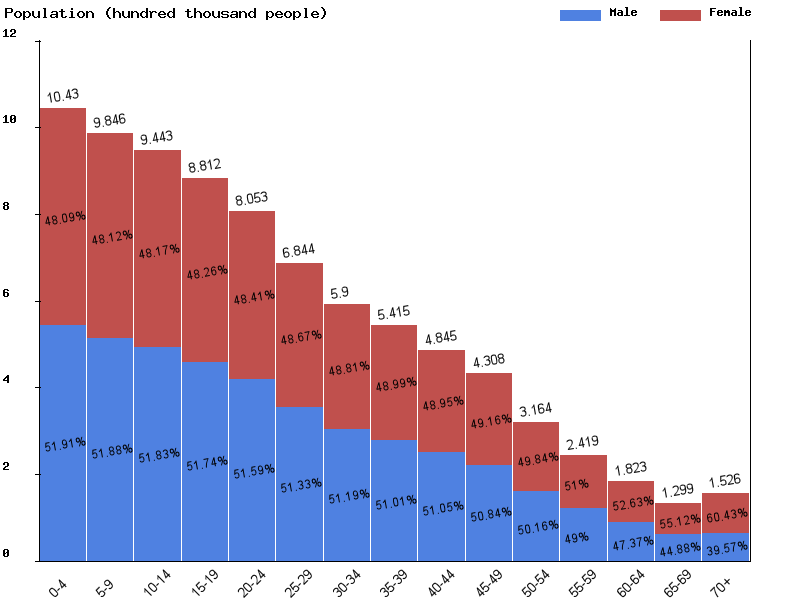
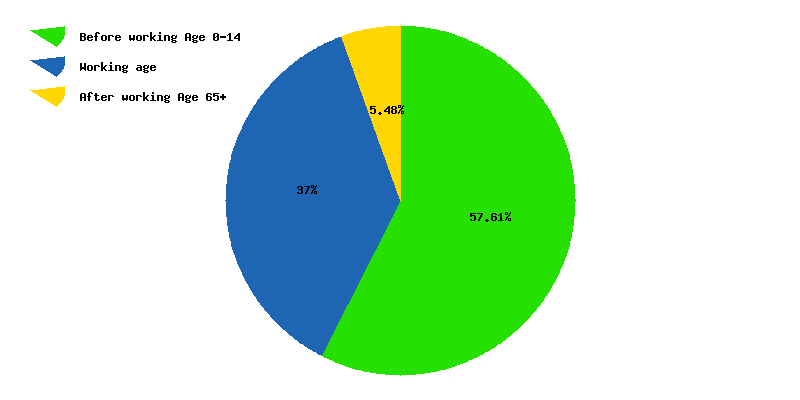
| Age | Both Sexes Population | Male Population | Female Population | Both Sexes (%) | Male (%) | Female (%) | Sex ratio (female/male) |
|---|---|---|---|---|---|---|---|
| Total | 8,412,725 | 4,291,260 | 4,121,465 | 100 | 100 | 100 | 104.1 |
| 00-04 | 1,042,951 | 541,362 | 501,589 | 12.4 | 12.6 | 12.2 | 107.9 |
| 05-09 | 984,615 | 510,815 | 473,800 | 11.7 | 11.9 | 11.5 | 107.8 |
| 10-14 | 944,349 | 489,470 | 454,879 | 11.2 | 11.4 | 11 | 107.6 |
| 15-19 | 881,170 | 455,950 | 425,220 | 10.5 | 10.6 | 10.3 | 107.2 |
| 20-24 | 805,256 | 415,412 | 389,844 | 9.6 | 9.7 | 9.5 | 106.6 |
| 25-29 | 684,434 | 351,344 | 333,090 | 8.1 | 8.2 | 8.1 | 105.5 |
| 30-34 | 590,029 | 302,024 | 288,005 | 7 | 7 | 7 | 104.9 |
| 35-39 | 541,544 | 276,251 | 265,293 | 6.4 | 6.4 | 6.4 | 104.1 |
| 40-44 | 484,495 | 247,312 | 237,183 | 5.8 | 5.8 | 5.8 | 104.3 |
| 45-49 | 430,839 | 219,052 | 211,787 | 5.1 | 5.1 | 5.1 | 103.4 |
| 50-54 | 316,403 | 158,716 | 157,687 | 3.8 | 3.7 | 3.8 | 100.7 |
| 55-59 | 241,860 | 118,508 | 123,352 | 2.9 | 2.8 | 3 | 96.1 |
| 60-64 | 182,306 | 86,360 | 95,946 | 2.2 | 2 | 2.3 | 90 |
| 65-69 | 129,907 | 58,307 | 71,600 | 1.5 | 1.4 | 1.7 | 81.4 |
| 70-74 | 78,620 | 33,178 | 45,442 | 0.9 | 0.8 | 1.1 | 73 |
| 75-79 | 43,589 | 17,042 | 26,547 | 0.5 | 0.4 | 0.6 | 64.2 |
| 80-84 | 20,572 | 7,252 | 13,320 | 0.2 | 0.2 | 0.3 | 54.4 |
| 85-89 | 7,463 | 2,319 | 5,144 | 0.1 | 0.1 | 0.1 | 45.1 |
| 90-94 | 1,959 | 512 | 1,447 | 0 | 0 | 0 | 35.4 |
| 95-99 | 330 | 69 | 261 | 0 | 0 | 0 | 26.4 |
| 100+ | 34 | 5 | 29 | 0 | 0 | 0 | 17.2 |
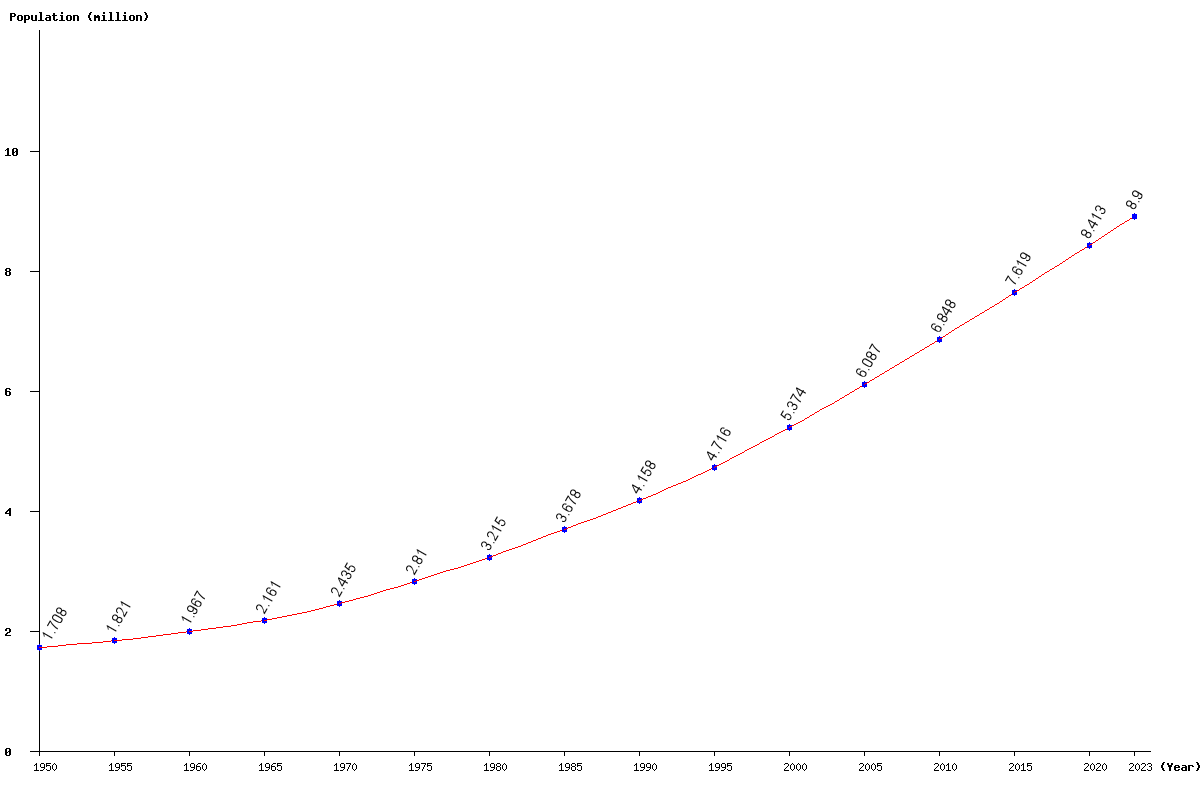
| Year | Population | Yearly % Change |
Yearly Change |
Sex ratio | Density (P/Km²) |
|---|---|---|---|---|---|
| 2023 | 8,899,840 | 1.87 | 163,210 | 104.10 | 19.65 |
| 2022 | 8,736,630 | 1.89 | 162,399 | 104.11 | 19.29 |
| 2021 | 8,574,231 | 1.92 | 161,506 | 104.11 | 18.93 |
| 2020 | 8,412,725 | 1.95 | 160,575 | 104.12 | 18.58 |
| 2019 | 8,252,150 | 1.97 | 159,632 | 104.12 | 18.22 |
| 2018 | 8,092,518 | 2.00 | 158,677 | 104.13 | 17.87 |
| 2017 | 7,933,841 | 2.03 | 157,726 | 104.13 | 17.52 |
| 2016 | 7,776,115 | 2.06 | 156,794 | 104.13 | 17.17 |
| 2015 | 7,619,321 | 2.09 | 155,744 | 104.13 | 16.82 |
| 2014 | 7,463,577 | 2.12 | 154,713 | 104.13 | 16.48 |
| 2013 | 7,308,864 | 2.15 | 153,994 | 104.13 | 16.14 |
| 2012 | 7,154,870 | 2.20 | 153,698 | 104.13 | 15.80 |
| 2011 | 7,001,172 | 2.24 | 153,655 | 104.12 | 15.46 |
| 2010 | 6,847,517 | 2.30 | 153,718 | 104.11 | 15.12 |
| 2005 | 6,086,905 | 13.26 | 712,854 | 104.05 | 13.44 |
| 2000 | 5,374,051 | 13.96 | 658,122 | 104.01 | 11.87 |
| 1995 | 4,715,929 | 13.42 | 558,026 | 104.13 | 10.41 |
| 1990 | 4,157,903 | 13.05 | 480,049 | 104.66 | 9.18 |
| 1985 | 3,677,854 | 14.38 | 462,371 | 105.31 | 8.12 |
| 1980 | 3,215,483 | 14.44 | 405,791 | 106.26 | 7.10 |
| 1975 | 2,809,692 | 15.40 | 374,937 | 106.55 | 6.20 |
| 1970 | 2,434,755 | 12.66 | 273,652 | 106.72 | 5.38 |
| 1965 | 2,161,103 | 9.87 | 194,146 | 107.17 | 4.77 |
| 1960 | 1,966,957 | 7.99 | 145,461 | 108.03 | 4.34 |
| 1955 | 1,821,496 | 6.63 | 113,304 | 109.29 | 4.02 |
| 1950 | 1,708,192 | 111.39 | 3.77 |