Madagascar population
24,430,325
Births this year: 0
Births today 0
Deaths this year 0
Deaths today 0
24,430,325
| Region Name | Percents | Number |
|---|---|---|
| indigenous beliefs | 52% | 12,703,769 people |
| Christian | 41% | 10,016,433 people |
| Muslim | 7% | 1,710,123 people |
| Ethnic groups Name | Percents | Number |
|---|---|---|
| Malayo-Indonesian (Merina and related Betsileo), Cotiers (mixed African, Malayo-Indonesian, and Arab ancestry - Betsimisaraka, Tsimihety, Antaisaka, Sakalava), French, Indian, Creole, Comoran | 100% | 24,430,325 people |
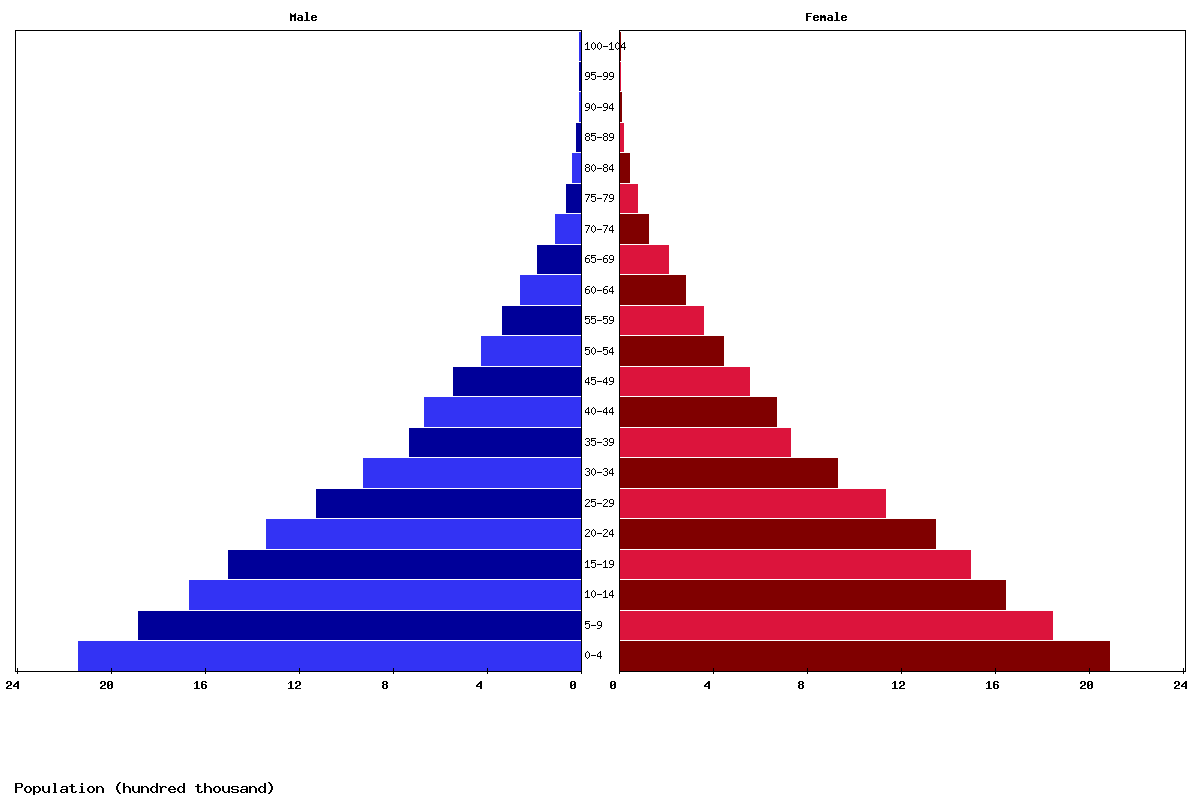
| Age | Both Sexes Population | Male Population | Female Population | Both Sexes (%) | Male (%) | Female (%) | Sex ratio (female/male) |
|---|---|---|---|---|---|---|---|
| Total | 27,798,964 | 13,870,212 | 13,928,752 | 100 | 100 | 100 | 99.6 |
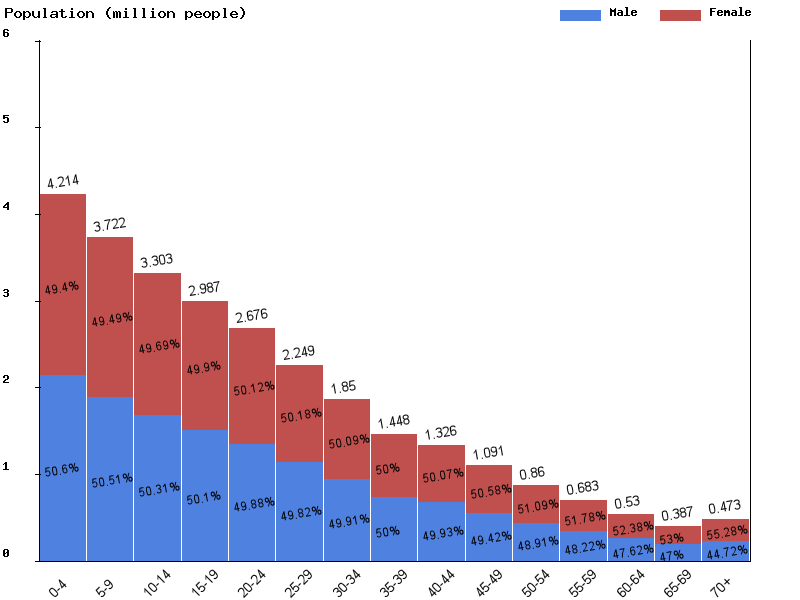
| 00-04 | 4,213,887 | 2,132,399 | 2,081,488 | 15.2 | 15.4 | 14.9 | 102.4 |
| 05-09 | 3,722,467 | 1,880,372 | 1,842,095 | 13.4 | 13.6 | 13.2 | 102.1 |
| 10-14 | 3,302,666 | 1,661,603 | 1,641,063 | 11.9 | 12 | 11.8 | 101.3 |
| 15-19 | 2,986,630 | 1,496,197 | 1,490,433 | 10.7 | 10.8 | 10.7 | 100.4 |
| 20-24 | 2,676,074 | 1,334,918 | 1,341,156 | 9.6 | 9.6 | 9.6 | 99.5 |
| 25-29 | 2,249,050 | 1,120,517 | 1,128,533 | 8.1 | 8.1 | 8.1 | 99.3 |
| 30-34 | 1,849,762 | 923,135 | 926,627 | 6.7 | 6.7 | 6.7 | 99.6 |
| 35-39 | 1,448,385 | 724,163 | 724,222 | 5.2 | 5.2 | 5.2 | 100 |
| 40-44 | 1,325,764 | 661,889 | 663,875 | 4.8 | 4.8 | 4.8 | 99.7 |
| 45-49 | 1,090,926 | 539,116 | 551,810 | 3.9 | 3.9 | 4 | 97.7 |
| 50-54 | 860,410 | 420,811 | 439,599 | 3.1 | 3 | 3.2 | 95.7 |
| 55-59 | 682,932 | 329,297 | 353,635 | 2.5 | 2.4 | 2.5 | 93.1 |
| 60-64 | 530,461 | 252,584 | 277,877 | 1.9 | 1.8 | 2 | 90.9 |
| 65-69 | 386,649 | 181,719 | 204,930 | 1.4 | 1.3 | 1.5 | 88.7 |
| 70-74 | 225,058 | 102,385 | 122,673 | 0.8 | 0.7 | 0.9 | 83.5 |
| 75-79 | 135,222 | 59,402 | 75,820 | 0.5 | 0.4 | 0.5 | 78.3 |
| 80-84 | 73,434 | 32,220 | 41,214 | 0.3 | 0.2 | 0.3 | 78.2 |
| 85-89 | 29,876 | 13,197 | 16,679 | 0.1 | 0.1 | 0.1 | 79.1 |
| 90-94 | 7,892 | 3,606 | 4,286 | 0 | 0 | 0 | 84.1 |
| 95-99 | 1,292 | 618 | 674 | 0 | 0 | 0 | 91.7 |
| 100+ | 127 | 64 | 63 | 0 | 0 | 0 | 101.6 |
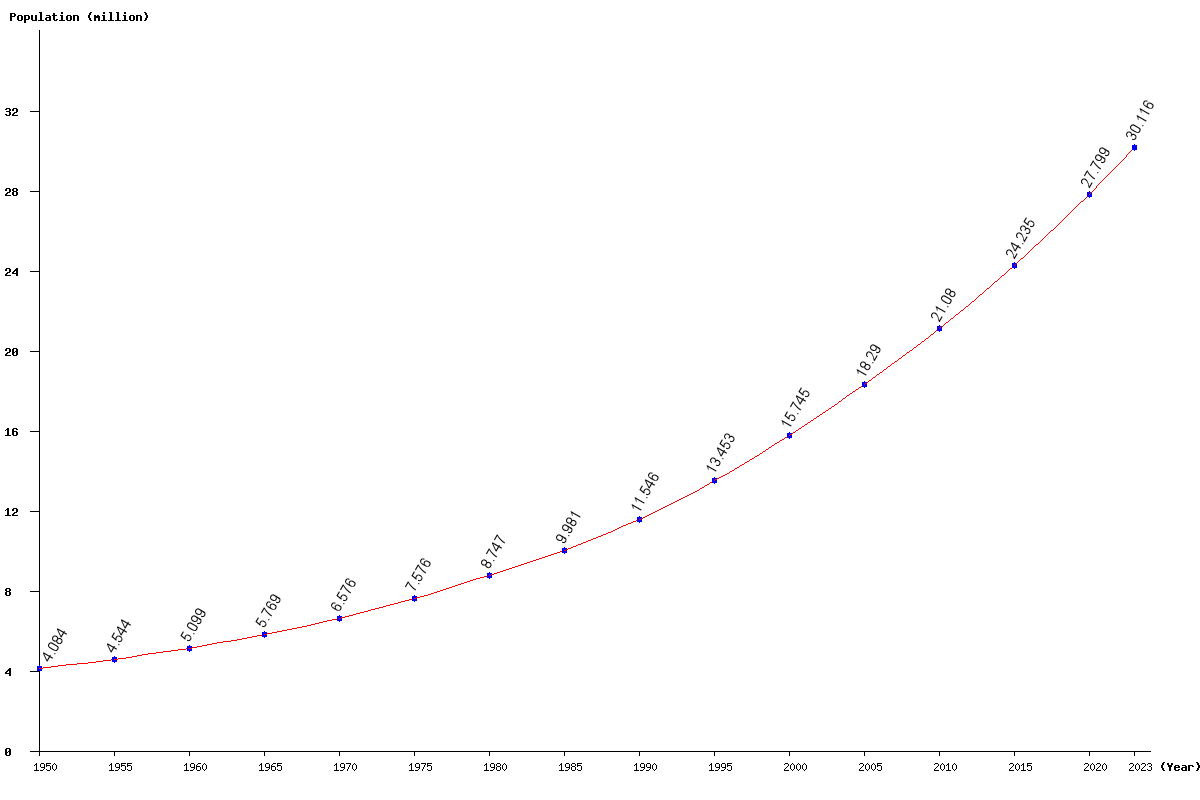
| Year | Population | Yearly % Change |
Yearly Change |
Sex ratio | Density (P/Km²) |
|---|---|---|---|---|---|
| 2023 | 30,116,332 | 2.68 | 786,399 | 99.66 | 51.76 |
| 2022 | 29,329,933 | 2.71 | 772,657 | 99.63 | 50.41 |
| 2021 | 28,557,276 | 2.73 | 758,312 | 99.61 | 49.08 |
| 2020 | 27,798,964 | 2.75 | 743,731 | 99.58 | 47.78 |
| 2019 | 27,055,233 | 2.77 | 728,881 | 99.55 | 46.50 |
| 2018 | 26,326,352 | 2.79 | 713,380 | 99.52 | 45.25 |
| 2017 | 25,612,972 | 2.80 | 697,150 | 99.49 | 44.02 |
| 2016 | 24,915,822 | 2.81 | 680,432 | 99.45 | 42.83 |
| 2015 | 24,235,390 | 2.82 | 663,677 | 99.42 | 41.66 |
| 2014 | 23,571,713 | 2.82 | 647,156 | 99.38 | 40.52 |
| 2013 | 22,924,557 | 2.83 | 630,837 | 99.35 | 39.40 |
| 2012 | 22,293,720 | 2.84 | 614,853 | 99.31 | 38.32 |
| 2011 | 21,678,867 | 2.84 | 599,335 | 99.28 | 37.26 |
| 2010 | 21,079,532 | 2.85 | 583,826 | 99.25 | 36.23 |
| 2005 | 18,290,394 | 16.17 | 2,545,583 | 99.17 | 31.44 |
| 2000 | 15,744,811 | 17.04 | 2,292,285 | 99.16 | 27.06 |
| 1995 | 13,452,526 | 16.51 | 1,906,744 | 99.35 | 23.12 |
| 1990 | 11,545,782 | 15.68 | 1,564,669 | 99.71 | 19.85 |
| 1985 | 9,981,113 | 14.12 | 1,234,597 | 100.11 | 17.16 |
| 1980 | 8,746,516 | 15.45 | 1,170,759 | 100.57 | 15.03 |
| 1975 | 7,575,757 | 15.20 | 999,456 | 101.12 | 13.02 |
| 1970 | 6,576,301 | 13.99 | 807,082 | 101.78 | 11.30 |
| 1965 | 5,769,219 | 13.14 | 669,848 | 102.53 | 9.92 |
| 1960 | 5,099,371 | 12.23 | 555,829 | 103.44 | 8.76 |
| 1955 | 4,543,542 | 11.26 | 459,988 | 104.54 | 7.81 |
| 1950 | 4,083,554 | 105.87 | 7.02 |