Lebanon population
6,797,270
Births this year: 848,133
Births today 101
Deaths this year 288,601
Deaths today 34
6,797,270
| Region Name | Percents | Number |
|---|---|---|
| Muslim (Sunni, Shia) 54, Christian (includes Maronite Catholic, Greek Orthodox, Greek Catholic, other Christian) 40.5 | 5440.5% | 339,364,136 people |
| Druze | 5.5% | 343,076 people |
| Ethnic groups Name | Percents | Number |
|---|---|---|
| Arab | 95% | 5,925,851 people |
| Armenian | 4% | 249,510 people |
| other | 1% | 62,377 people |
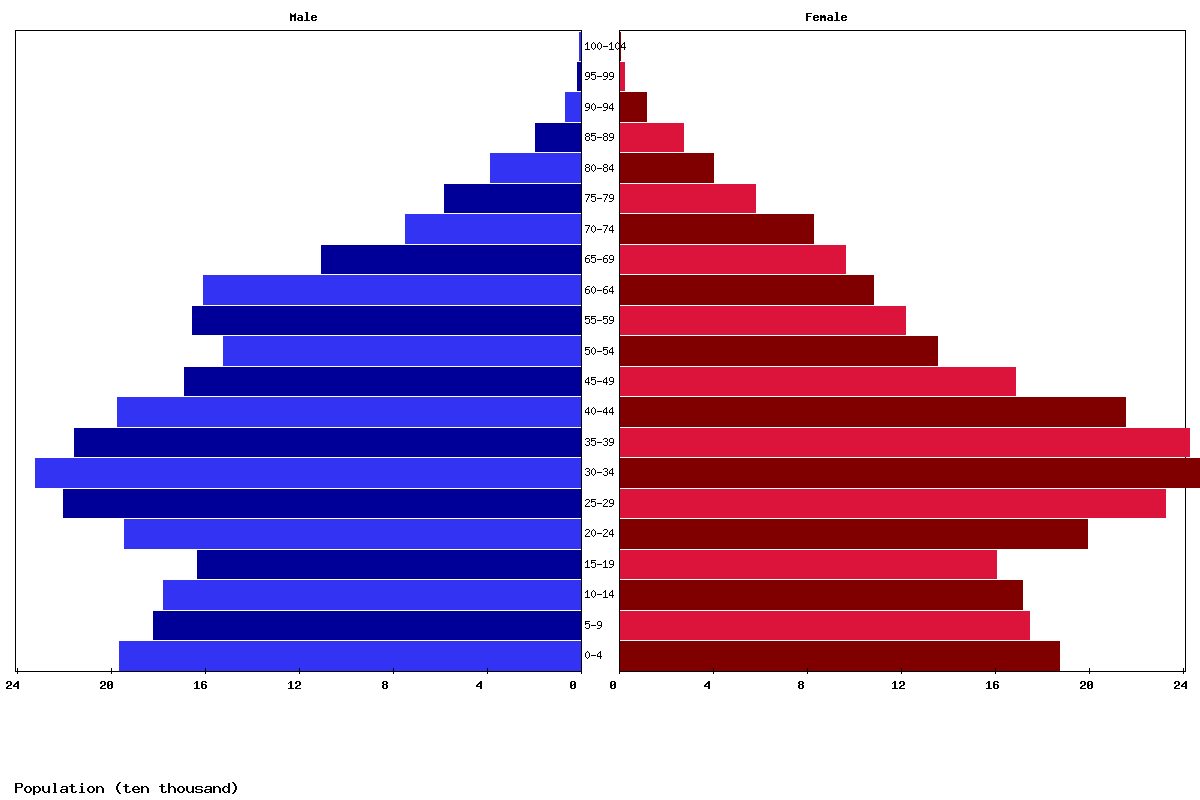
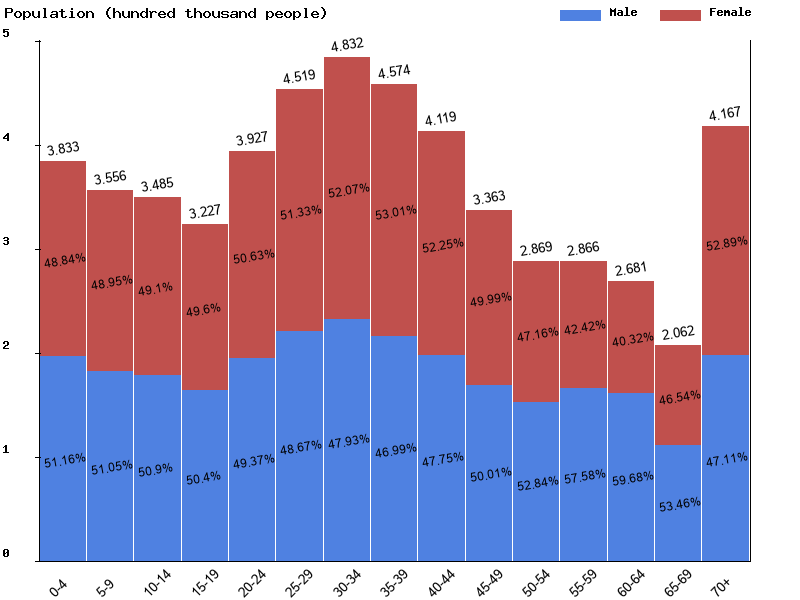
| Age | Both Sexes Population | Male Population | Female Population | Both Sexes (%) | Male (%) | Female (%) | Sex ratio (female/male) |
|---|---|---|---|---|---|---|---|
| Total | 5,407,997 | 2,725,996 | 2,682,001 | 100 | 100 | 100 | 101.6 |
| 00-04 | 383,276 | 196,078 | 187,198 | 7.1 | 7.2 | 7 | 104.7 |
| 05-09 | 355,592 | 181,526 | 174,066 | 6.6 | 6.7 | 6.5 | 104.3 |
| 10-14 | 348,489 | 177,387 | 171,102 | 6.4 | 6.5 | 6.4 | 103.7 |
| 15-19 | 322,718 | 162,654 | 160,064 | 6 | 6 | 6 | 101.6 |
| 20-24 | 392,745 | 193,881 | 198,864 | 7.3 | 7.1 | 7.4 | 97.5 |
| 25-29 | 451,943 | 219,944 | 231,999 | 8.4 | 8.1 | 8.7 | 94.8 |
| 30-34 | 483,162 | 231,594 | 251,568 | 8.9 | 8.5 | 9.4 | 92.1 |
| 35-39 | 457,359 | 214,904 | 242,455 | 8.5 | 7.9 | 9 | 88.6 |
| 40-44 | 411,923 | 196,678 | 215,245 | 7.6 | 7.2 | 8 | 91.4 |
| 45-49 | 336,344 | 168,212 | 168,132 | 6.2 | 6.2 | 6.3 | 100 |
| 50-54 | 286,865 | 151,590 | 135,275 | 5.3 | 5.6 | 5 | 112.1 |
| 55-59 | 286,579 | 165,017 | 121,562 | 5.3 | 6.1 | 4.5 | 135.7 |
| 60-64 | 268,084 | 160,002 | 108,082 | 5 | 5.9 | 4 | 148 |
| 65-69 | 206,170 | 110,209 | 95,961 | 3.8 | 4 | 3.6 | 114.8 |
| 70-74 | 156,749 | 74,260 | 82,489 | 2.9 | 2.7 | 3.1 | 90 |
| 75-79 | 115,203 | 57,710 | 57,493 | 2.1 | 2.1 | 2.1 | 100.4 |
| 80-84 | 77,935 | 38,293 | 39,642 | 1.4 | 1.4 | 1.5 | 96.6 |
| 85-89 | 45,948 | 18,910 | 27,038 | 0.8 | 0.7 | 1 | 69.9 |
| 90-94 | 17,454 | 6,065 | 11,389 | 0.3 | 0.2 | 0.4 | 53.3 |
| 95-99 | 3,112 | 1,001 | 2,111 | 0.1 | 0 | 0.1 | 47.4 |
| 100+ | 347 | 81 | 266 | 0 | 0 | 0 | 30.5 |
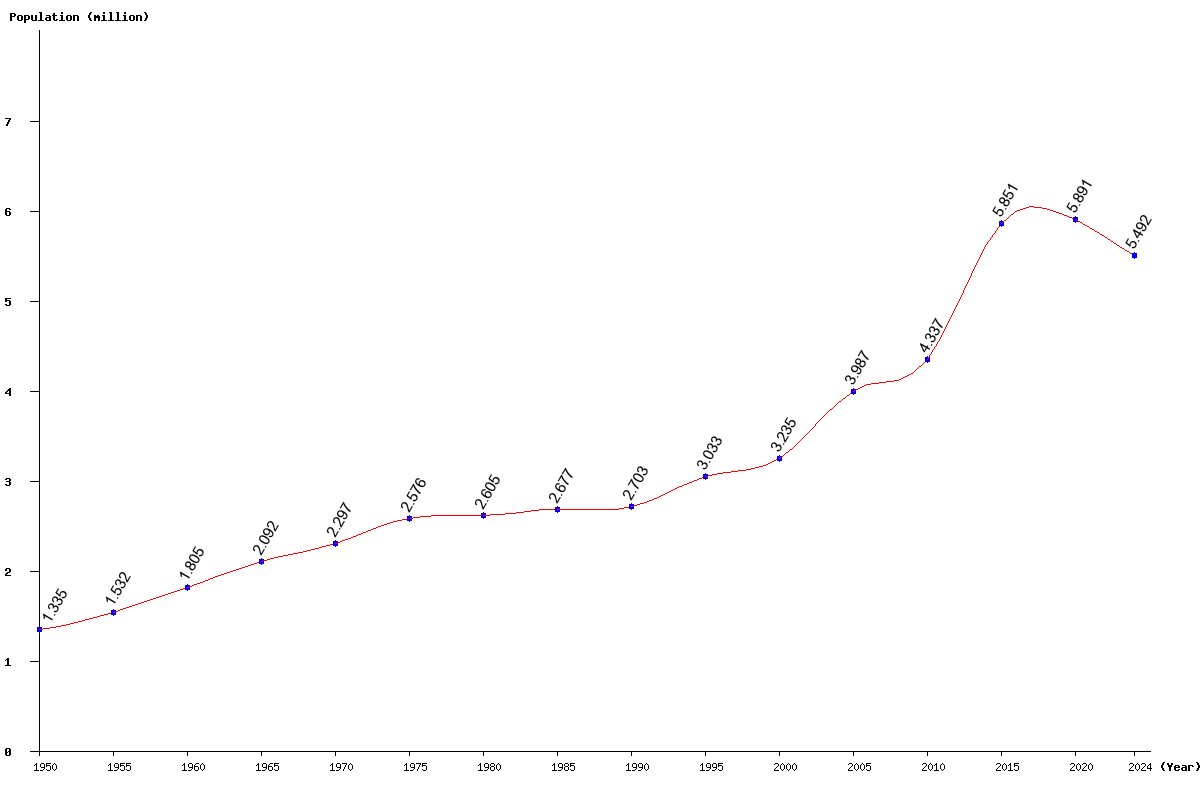
| Year | Population | Yearly % Change |
Yearly Change |
Sex ratio | Density (P/Km²) |
|---|---|---|---|---|---|
| 2024 | 5,491,940 | -1.81 | -101,055 | 101.52 | 536.85 |
| 2023 | 5,592,995 | -1.90 | -108,568 | 101.39 | 546.72 |
| 2022 | 5,701,563 | -1.78 | -103,266 | 101.24 | 557.34 |
| 2021 | 5,804,829 | -1.47 | -86,666 | 101.10 | 567.43 |
| 2020 | 5,891,495 | -1.23 | -73,154 | 100.98 | 575.90 |
| 2019 | 5,964,649 | -0.95 | -56,980 | 100.85 | 583.05 |
| 2018 | 6,021,629 | -0.29 | -17,648 | 100.73 | 588.62 |
| 2017 | 6,039,277 | 0.85 | 51,124 | 100.67 | 590.35 |
| 2016 | 5,988,153 | 2.35 | 137,410 | 100.71 | 585.35 |
| 2015 | 5,850,743 | 4.25 | 238,647 | 100.90 | 571.92 |
| 2014 | 5,612,096 | 6.15 | 325,106 | 101.29 | 548.59 |
| 2013 | 5,286,990 | 7.37 | 362,733 | 101.89 | 516.81 |
| 2012 | 4,924,257 | 7.24 | 332,559 | 102.65 | 481.35 |
| 2011 | 4,591,698 | 5.87 | 254,542 | 103.43 | 448.85 |
| 2010 | 4,337,156 | 3.72 | 155,414 | 104.06 | 423.96 |
| 2005 | 3,986,865 | 23.23 | 751,485 | 103.32 | 389.72 |
| 2000 | 3,235,380 | 6.66 | 201,974 | 98.46 | 316.26 |
| 1995 | 3,033,406 | 12.22 | 330,387 | 98.34 | 296.52 |
| 1990 | 2,703,019 | 0.99 | 26,426 | 97.30 | 264.22 |
| 1985 | 2,676,593 | 2.74 | 71,299 | 97.78 | 261.64 |
| 1980 | 2,605,294 | 1.15 | 29,601 | 98.31 | 254.67 |
| 1975 | 2,575,693 | 12.11 | 278,290 | 101.97 | 251.78 |
| 1970 | 2,297,403 | 9.80 | 205,049 | 102.02 | 224.58 |
| 1965 | 2,092,354 | 15.92 | 287,427 | 101.57 | 204.53 |
| 1960 | 1,804,927 | 17.81 | 272,816 | 101.15 | 176.43 |
| 1955 | 1,532,111 | 14.80 | 197,493 | 101.19 | 149.77 |
| 1950 | 1,334,618 | 101.32 | 130.46 |